
 PrizmikAca
 PrizmikWeb
 PrizmikFunc
 PrizmikApi
 PrizmikSwa
 PrizmikSuite
 The Azure Portal is the center of the universe for millions of developers. It's vast, it's powerful, and it's where the cloud happens. But what if we told you there are secret levels? Hidden rooms and powerful tools the portal doesn't give you access to? Here are 10 superpowers you can unlock for Azure that you won't find in the portal.
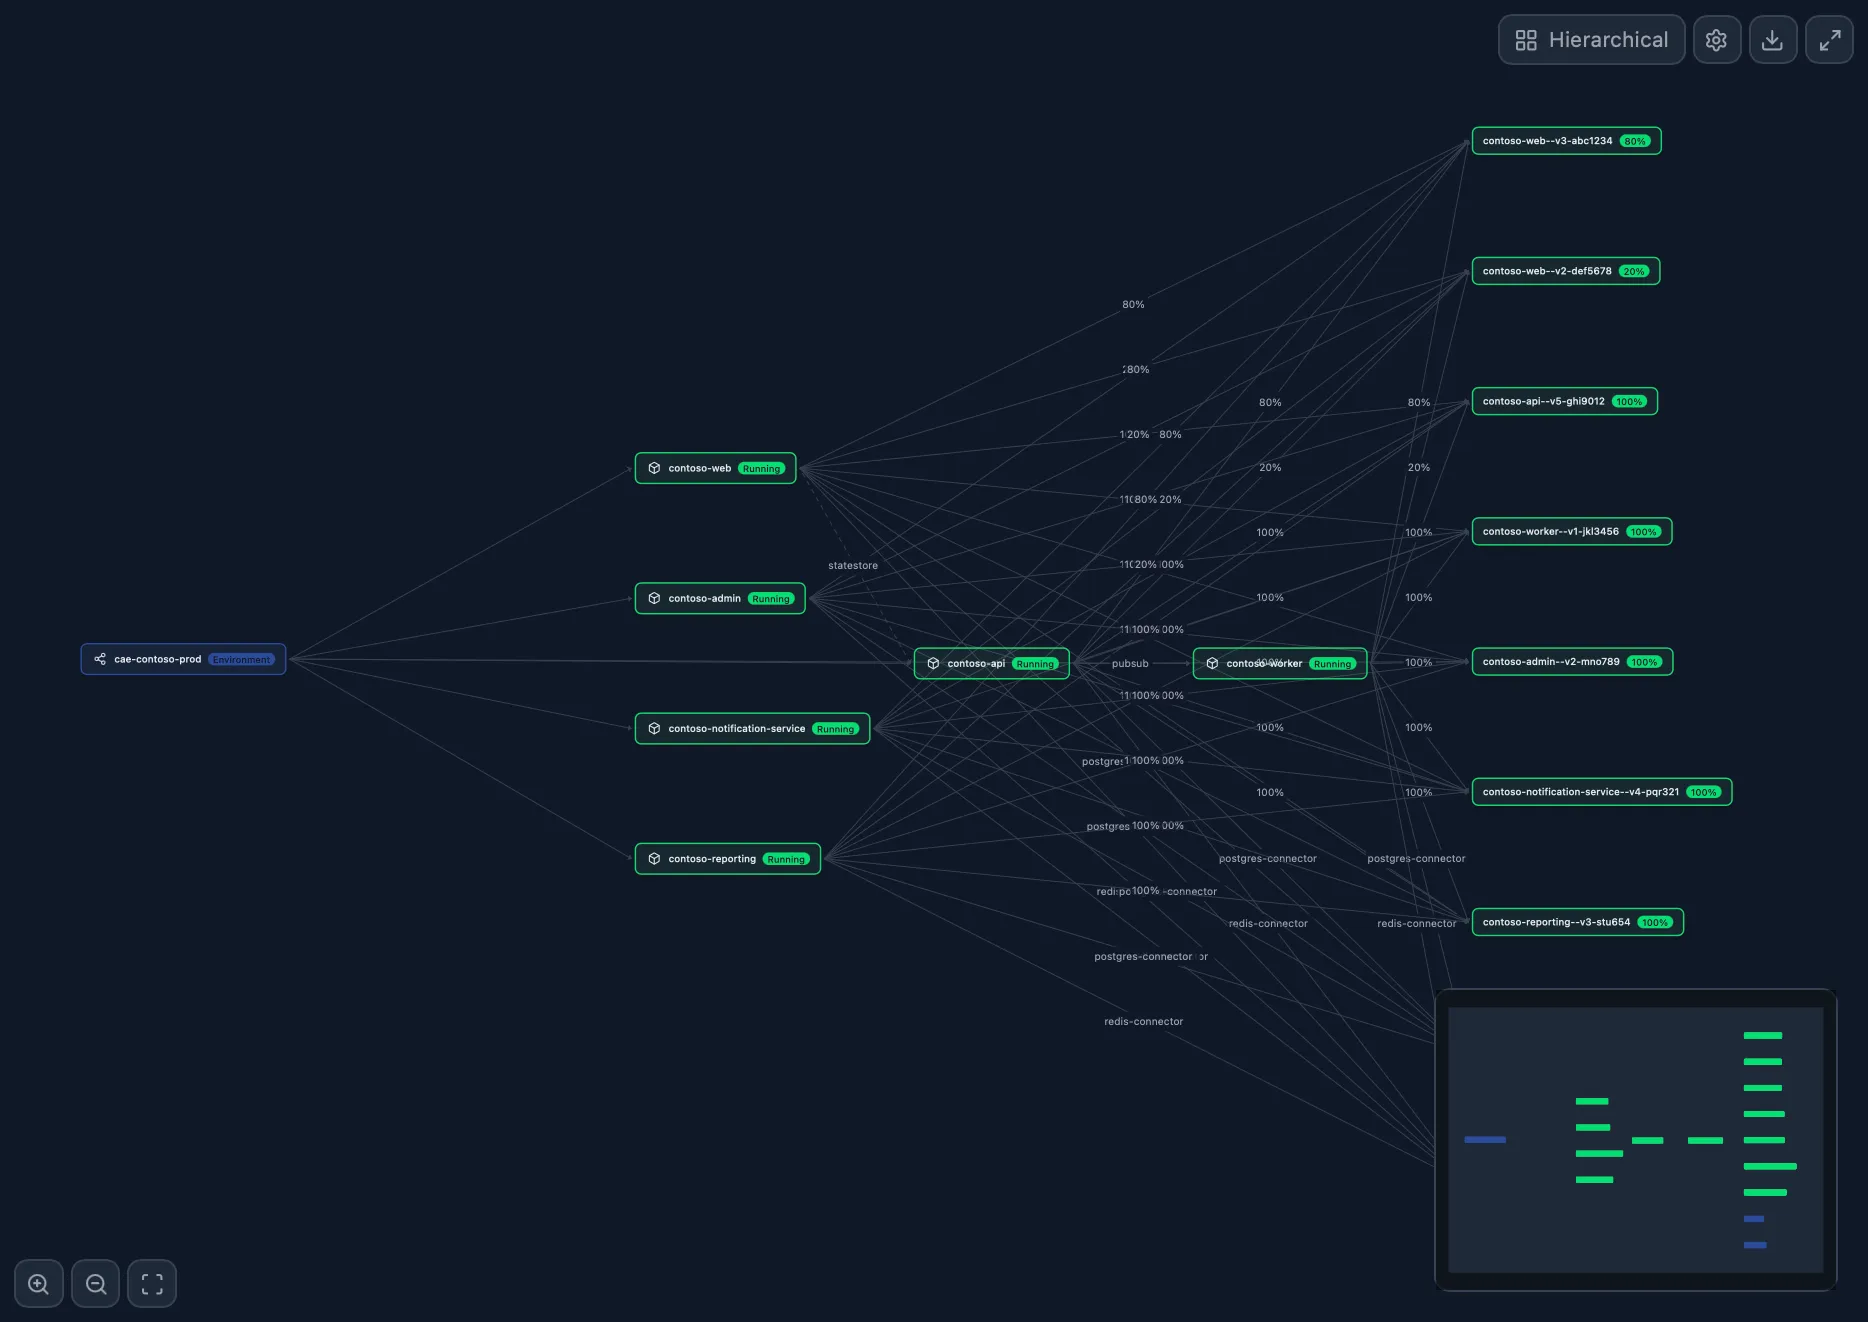
1. See Your Architecture, Not Just a List
The Portal gives you a flat list of apps. But your system isn't a list; it's a network. Prizmik's Topology Graph shows you your entire Container Apps environment as a living, interactive map. You can finally see how every app, revision, and replica connects. It's the difference between a phone book and a GPS.

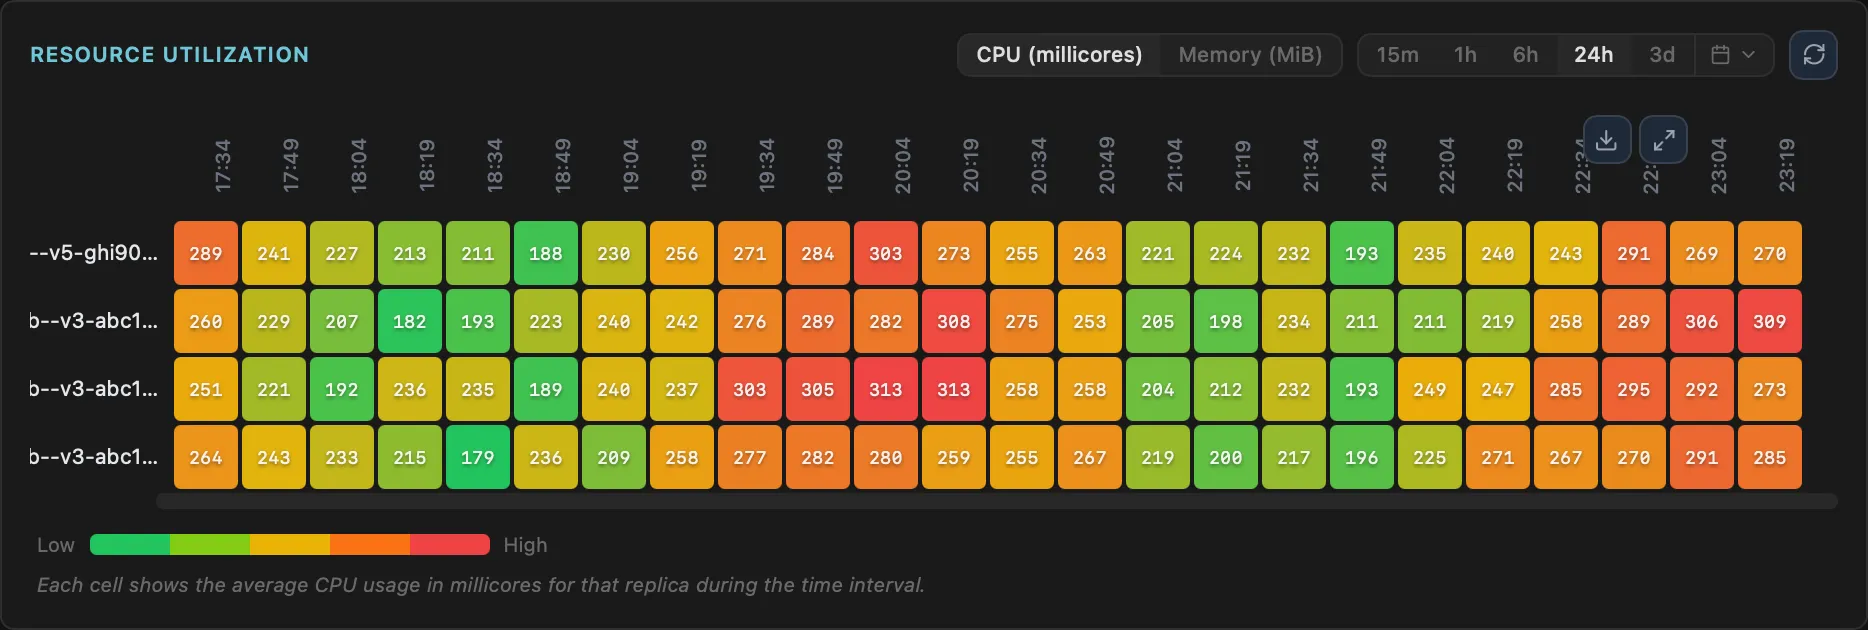
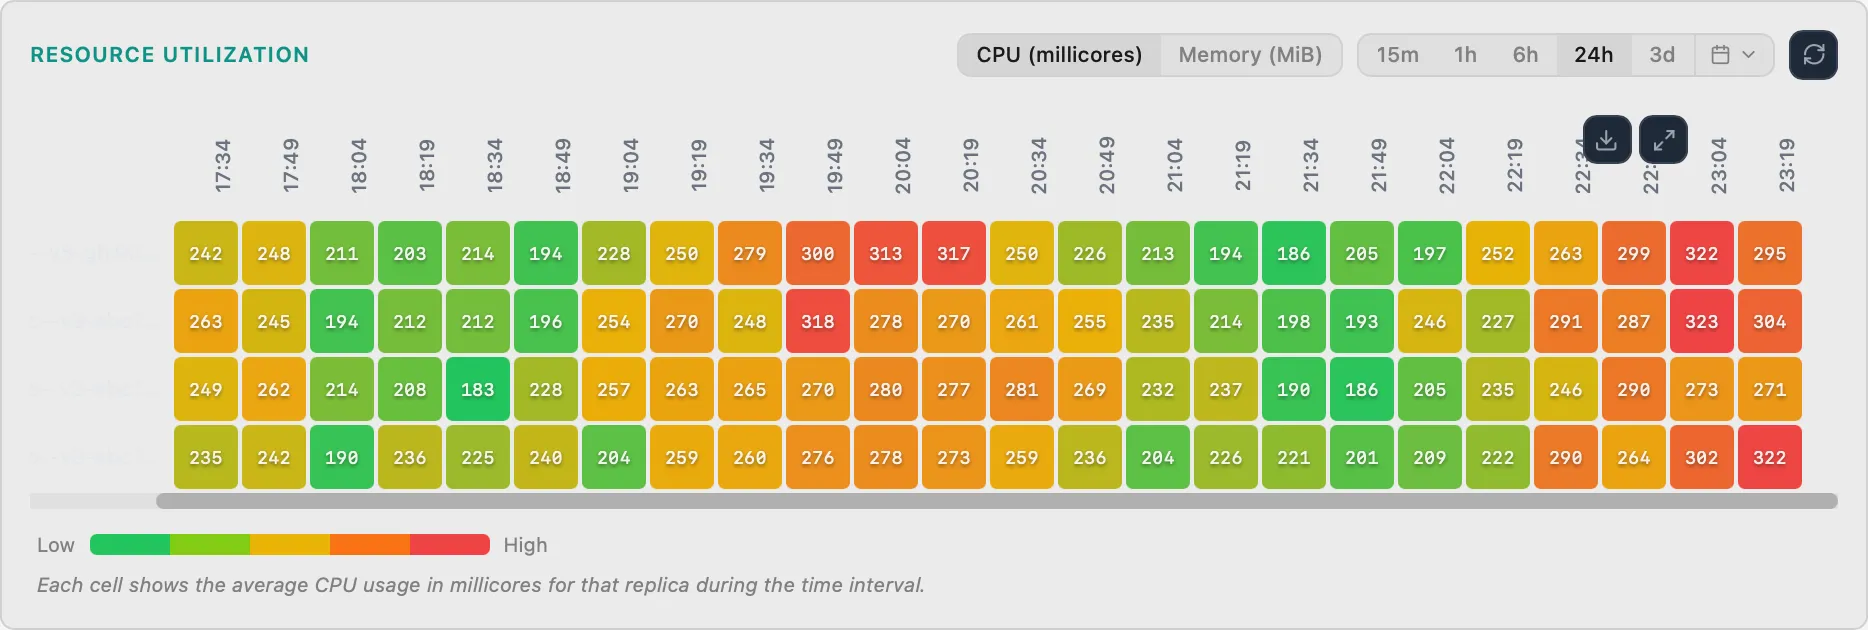
2. Find the Noisy Neighbor
The Portal tells you an app is slow, but not which part. When one replica in your Container App starts hogging memory, how do you find it? With Prizmik's Replica Heatmap, it's impossible to miss. See CPU and memory usage across all replicas in a simple, color-coded grid and spot the misbehaving one instantly.
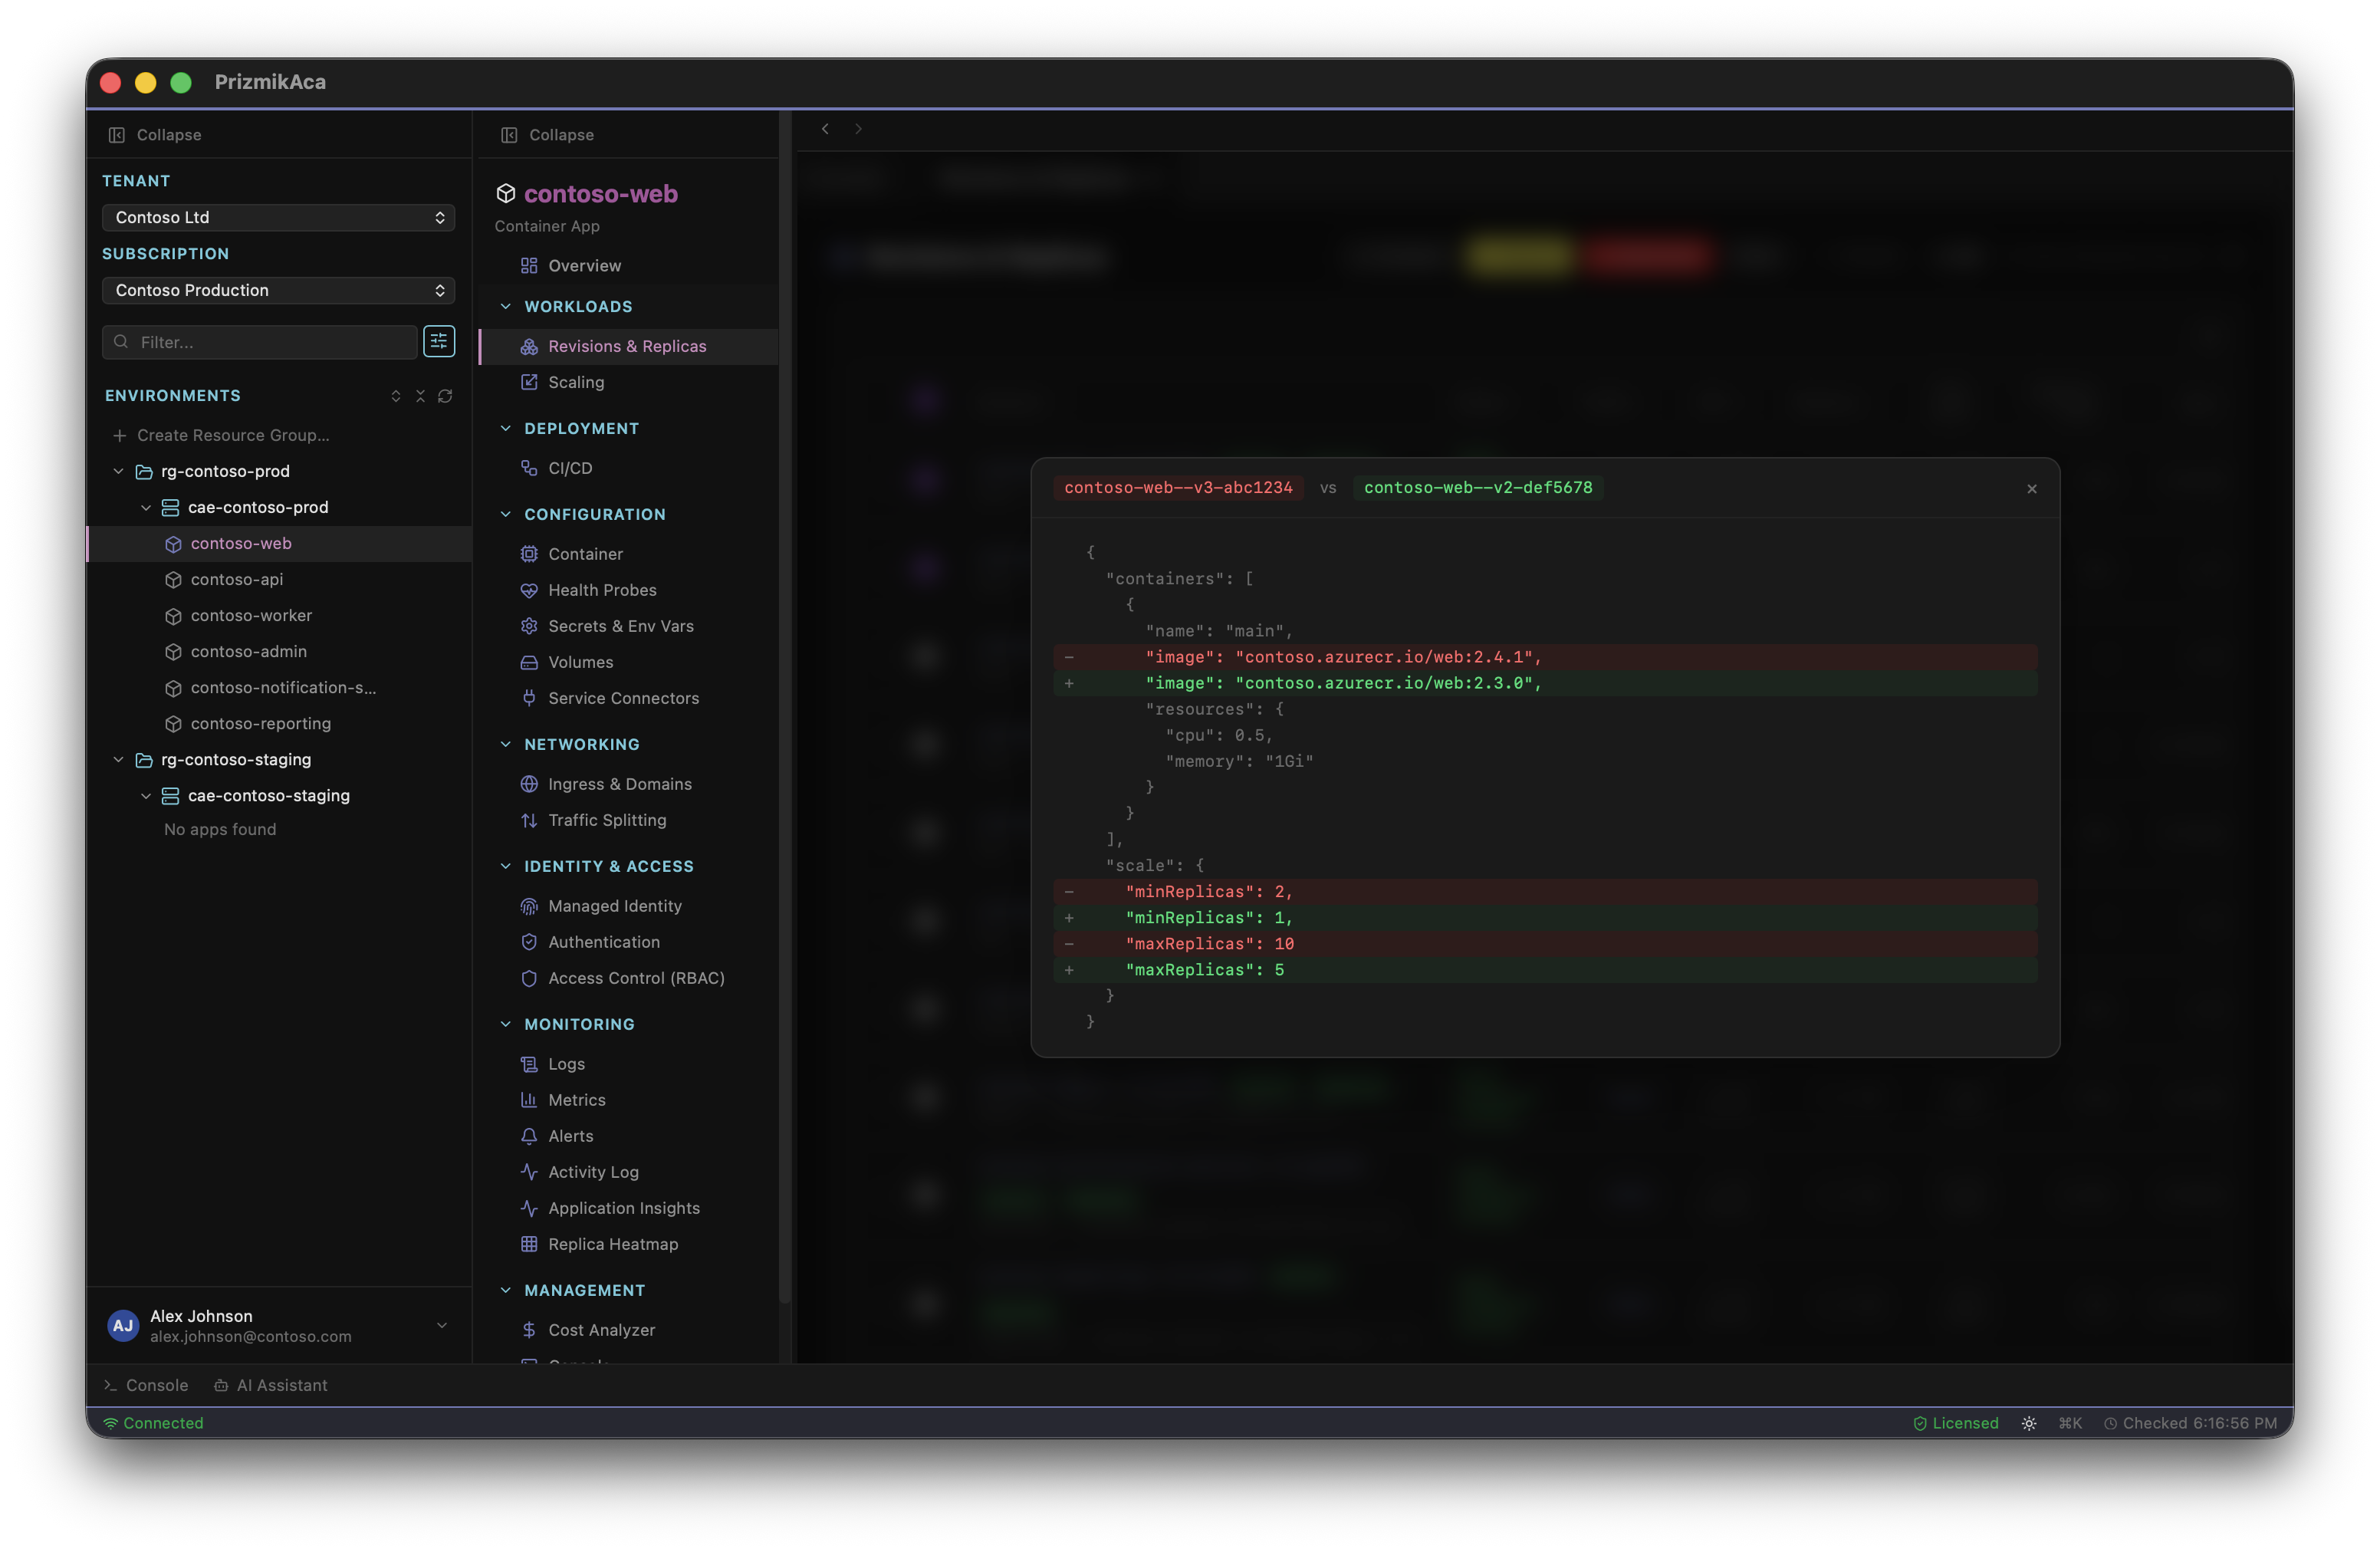
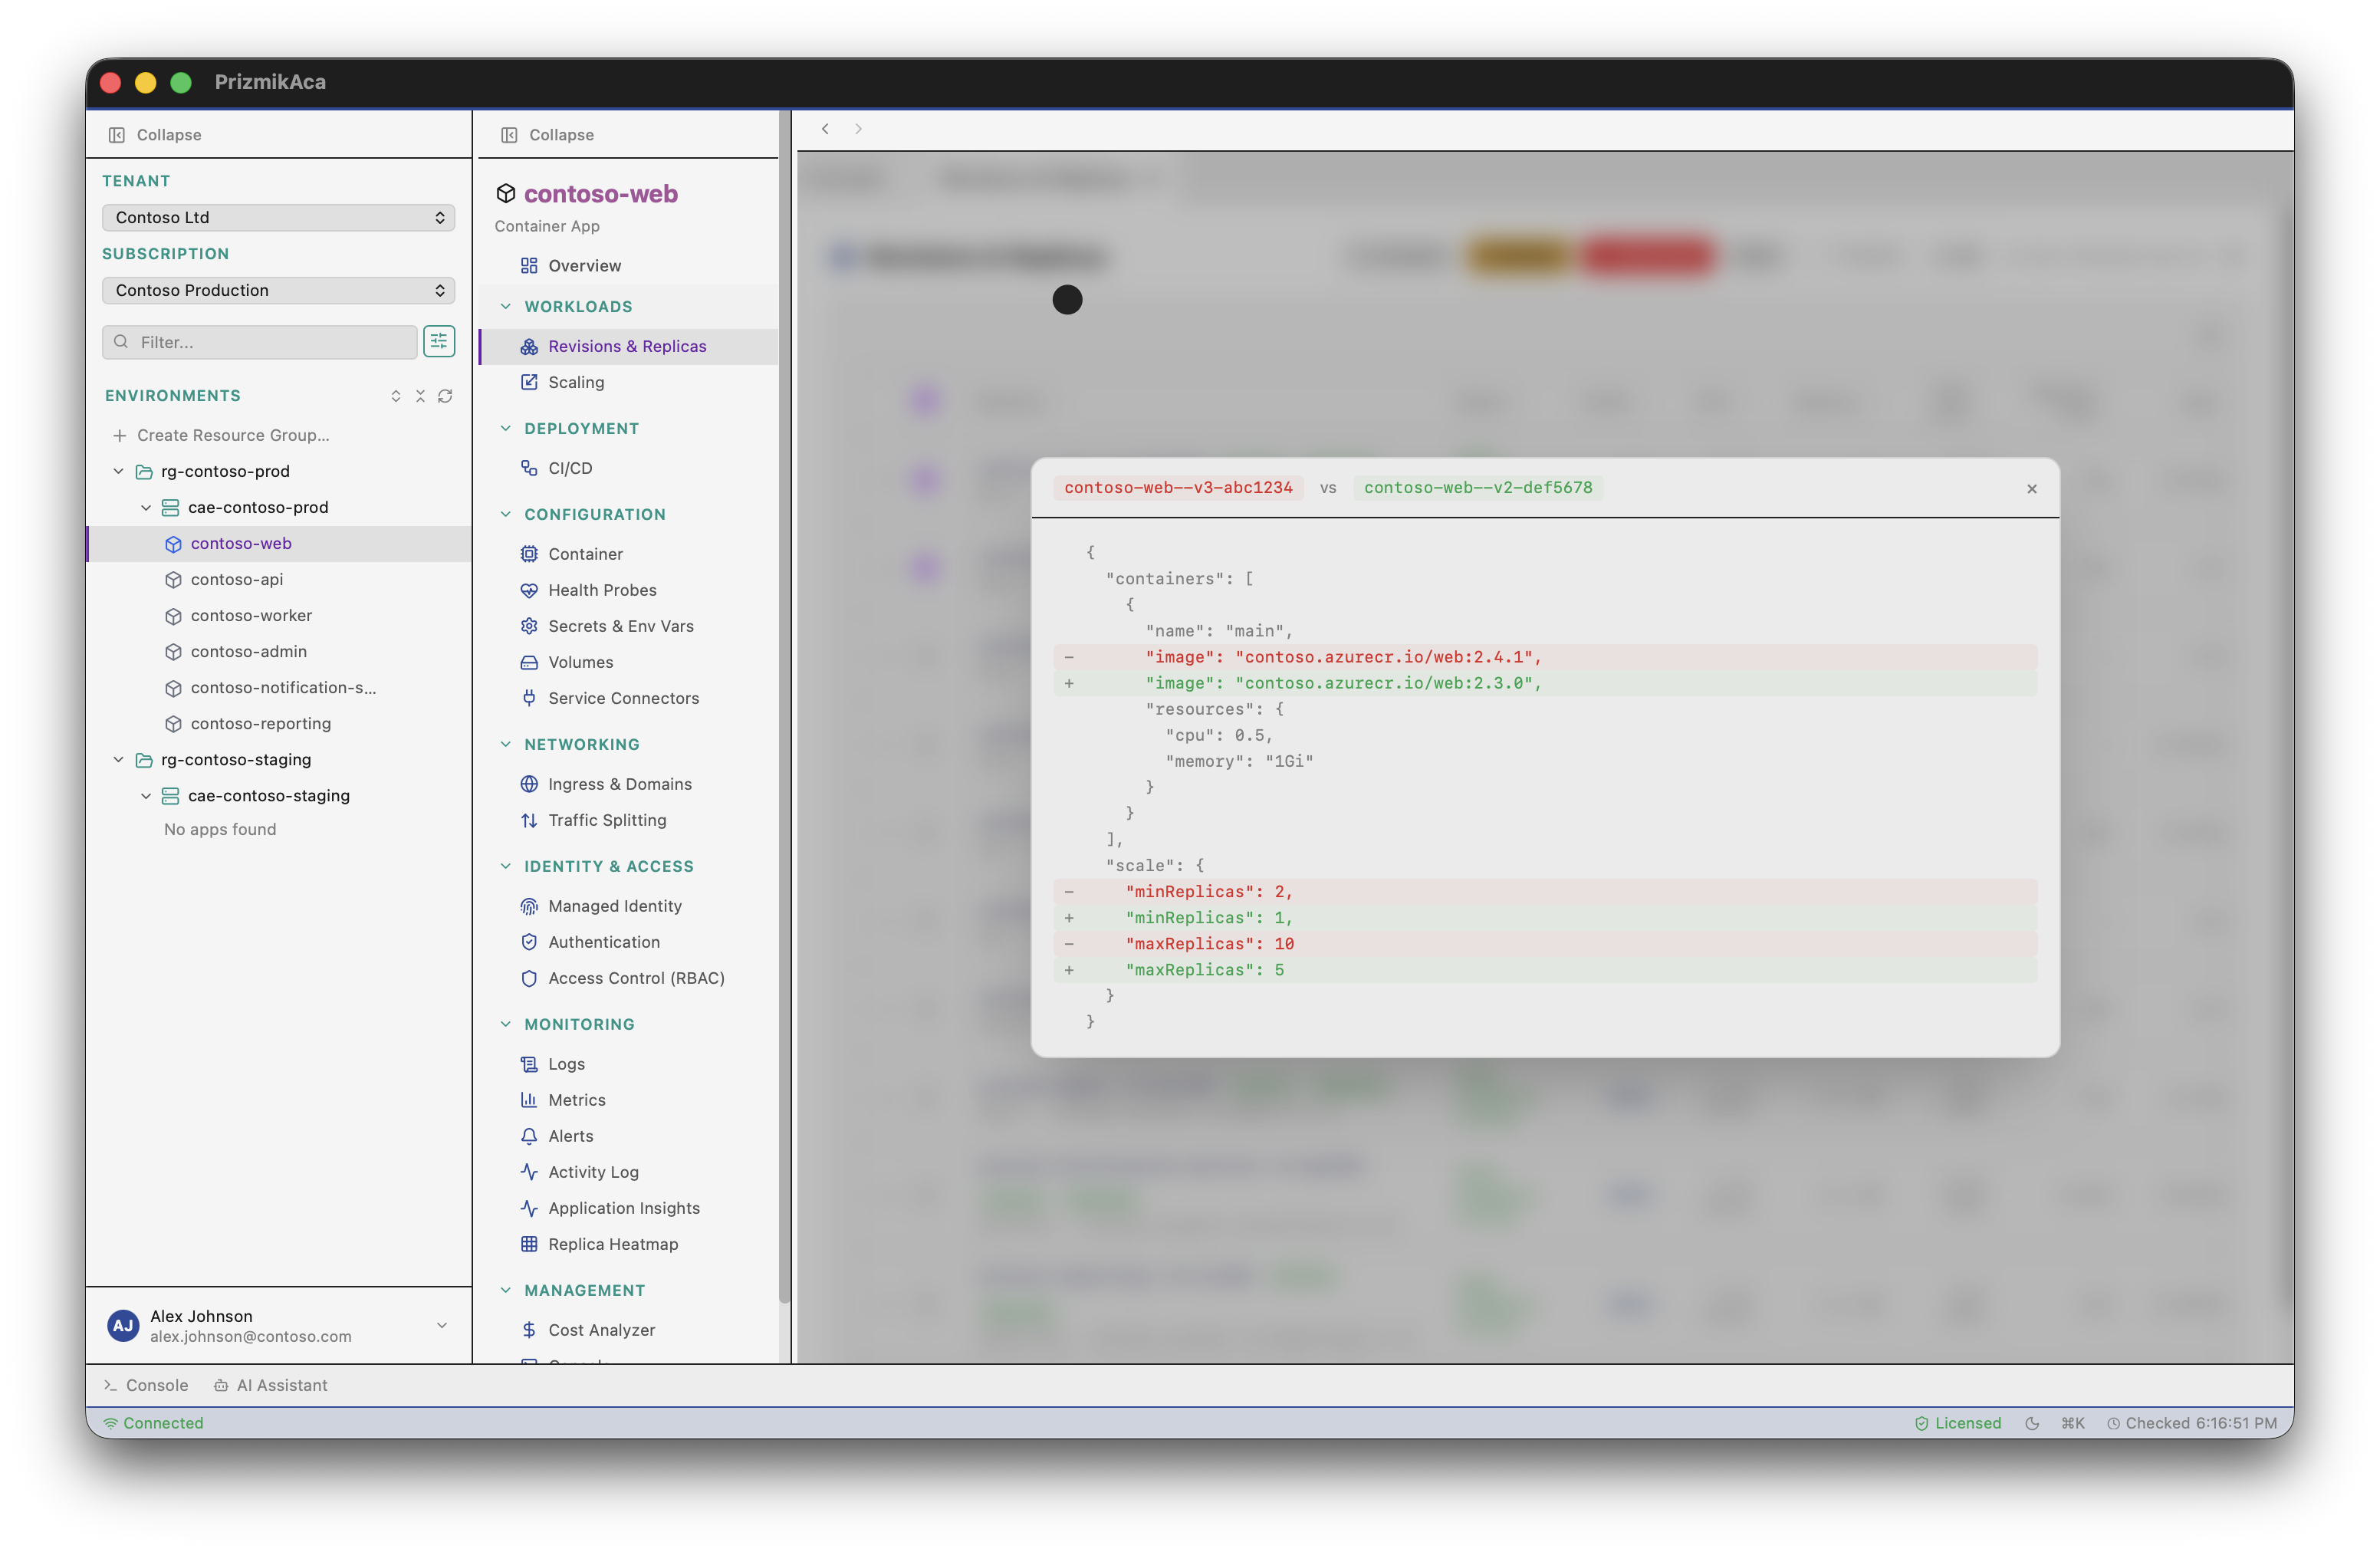
3. Perform Deployment Forensics
The Portal tells you a deployment happened, but not what changed. After every release comes the question: did it work? Prizmik's Deployment Diff lets you compare any two deployments side-by-side. See exactly which app settings and configuration values changed, and deploy with engineering certainty, not hope.
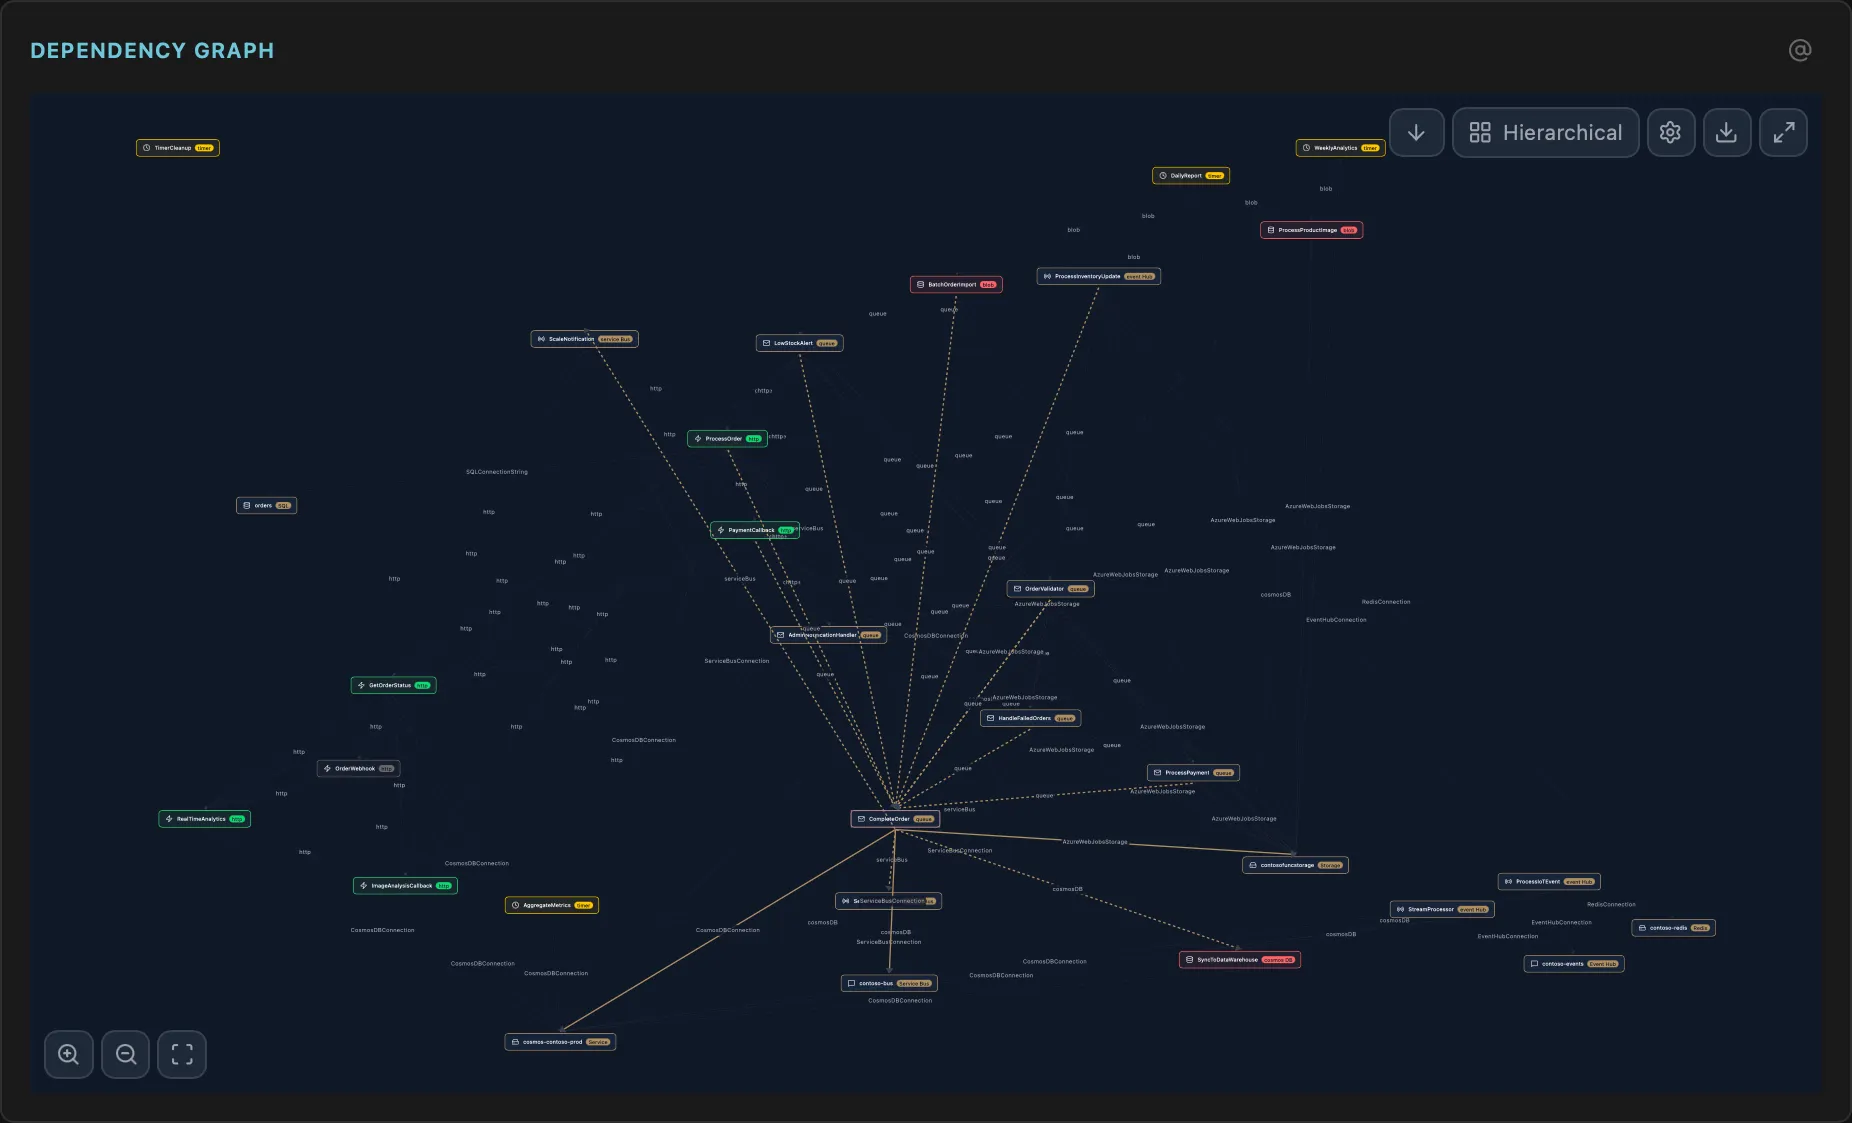
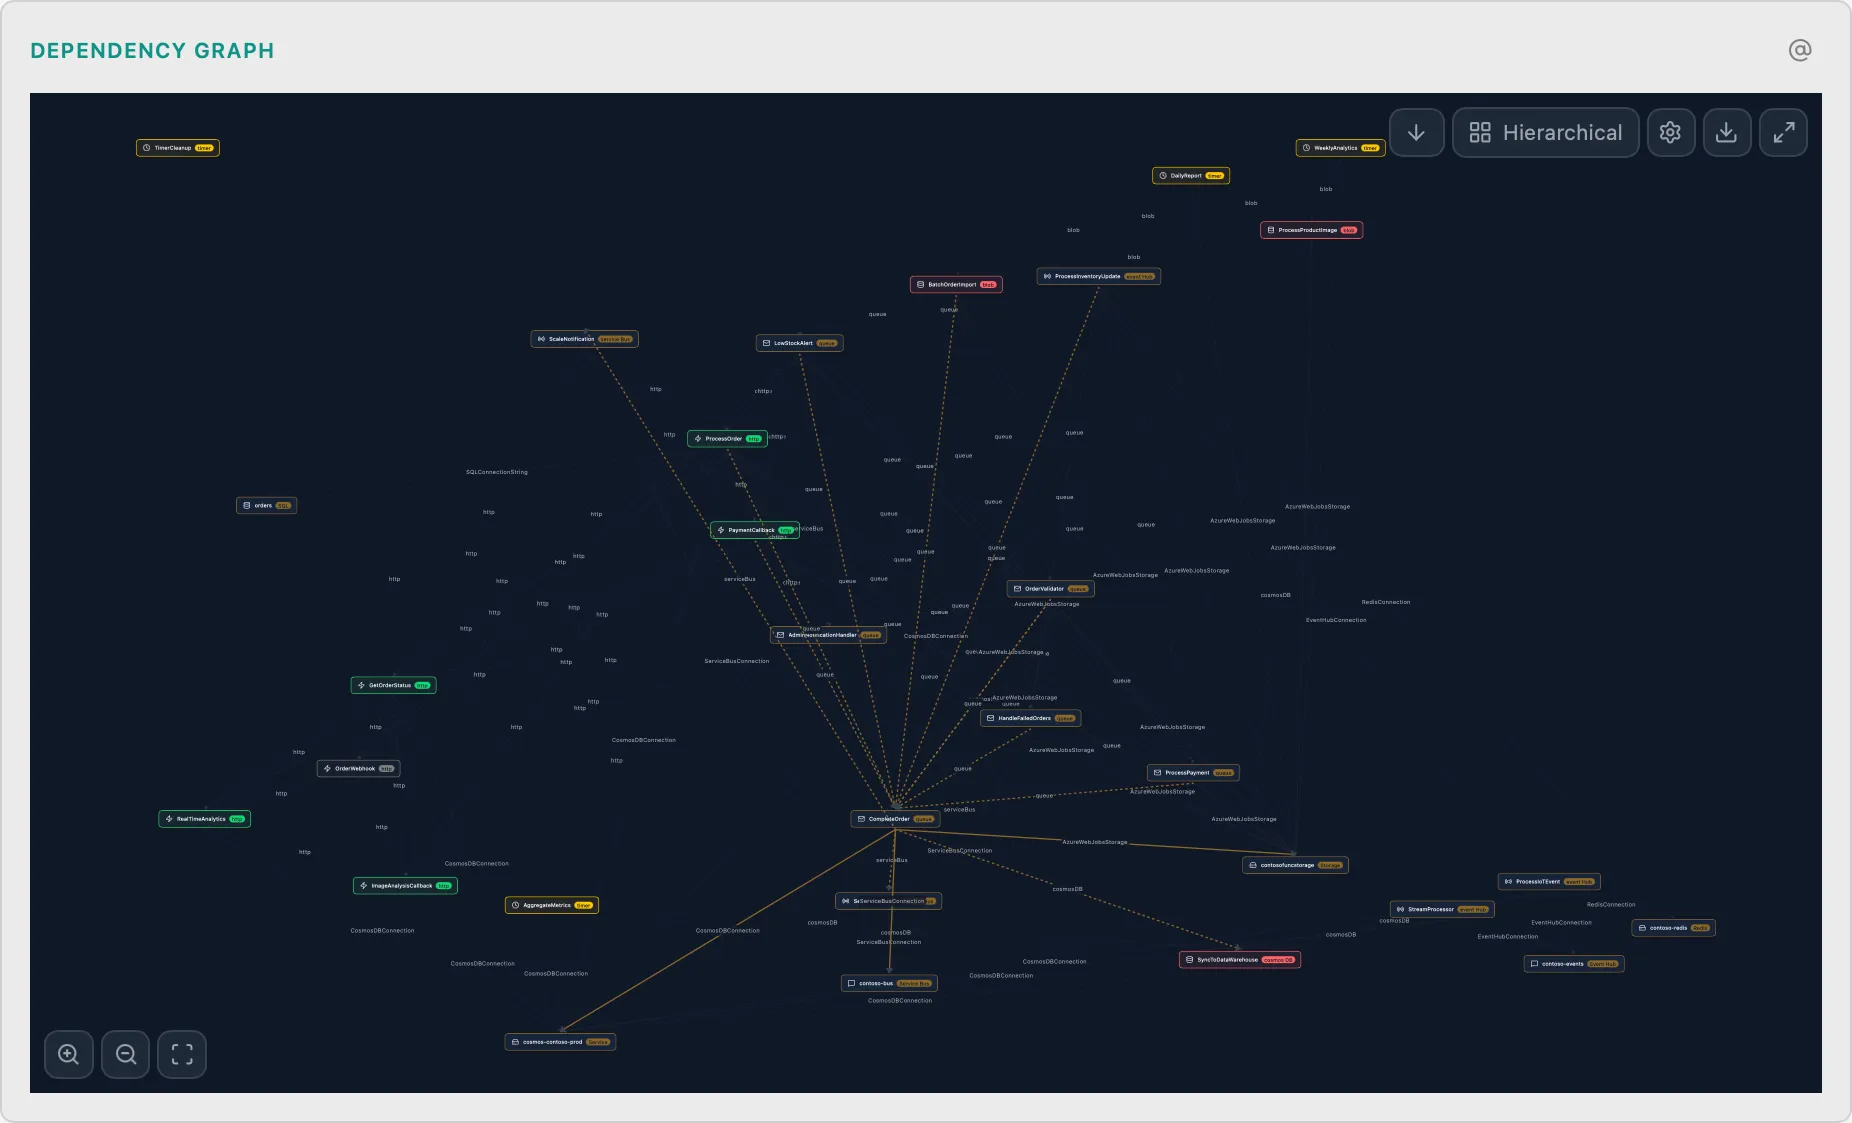
4. Uncover Your Serverless Blueprint
The Portal shows you functions, but not how they're wired. A complex serverless application can feel like a black box. Prizmik's Function Dependency Graph generates a visual blueprint of your architecture, showing how every function, trigger, and binding connects. Finally, you can see the design behind the code.
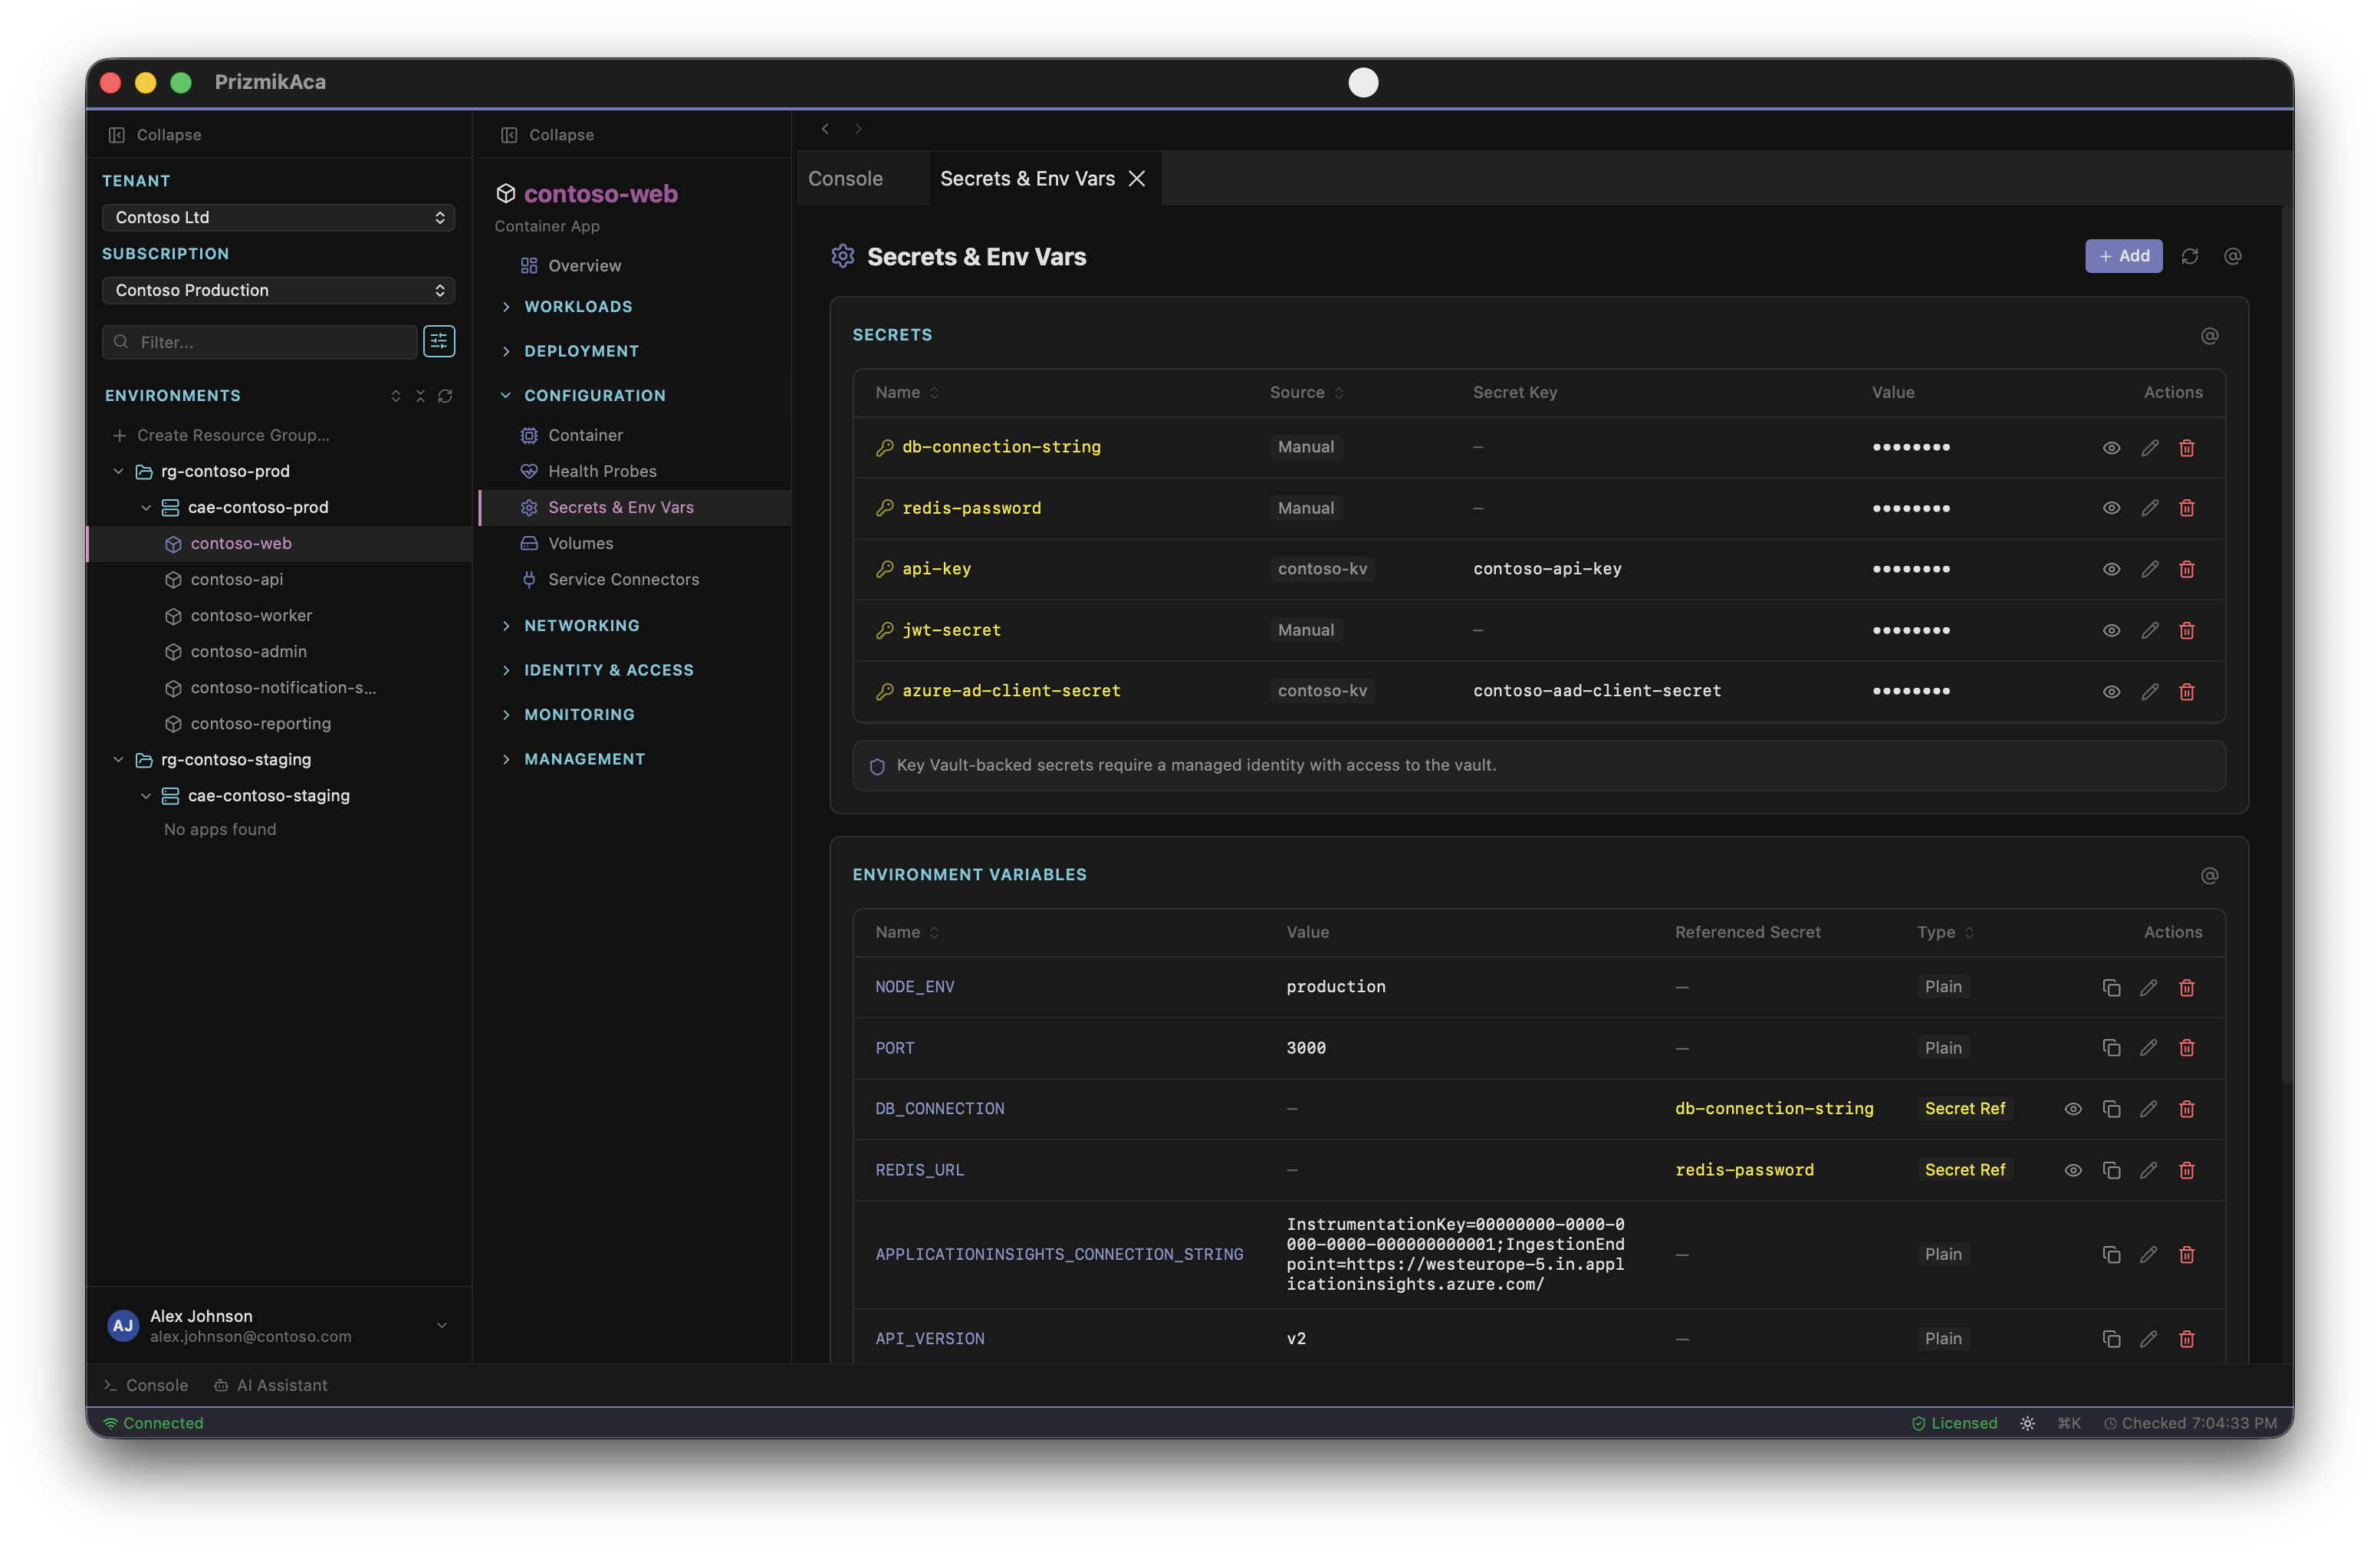
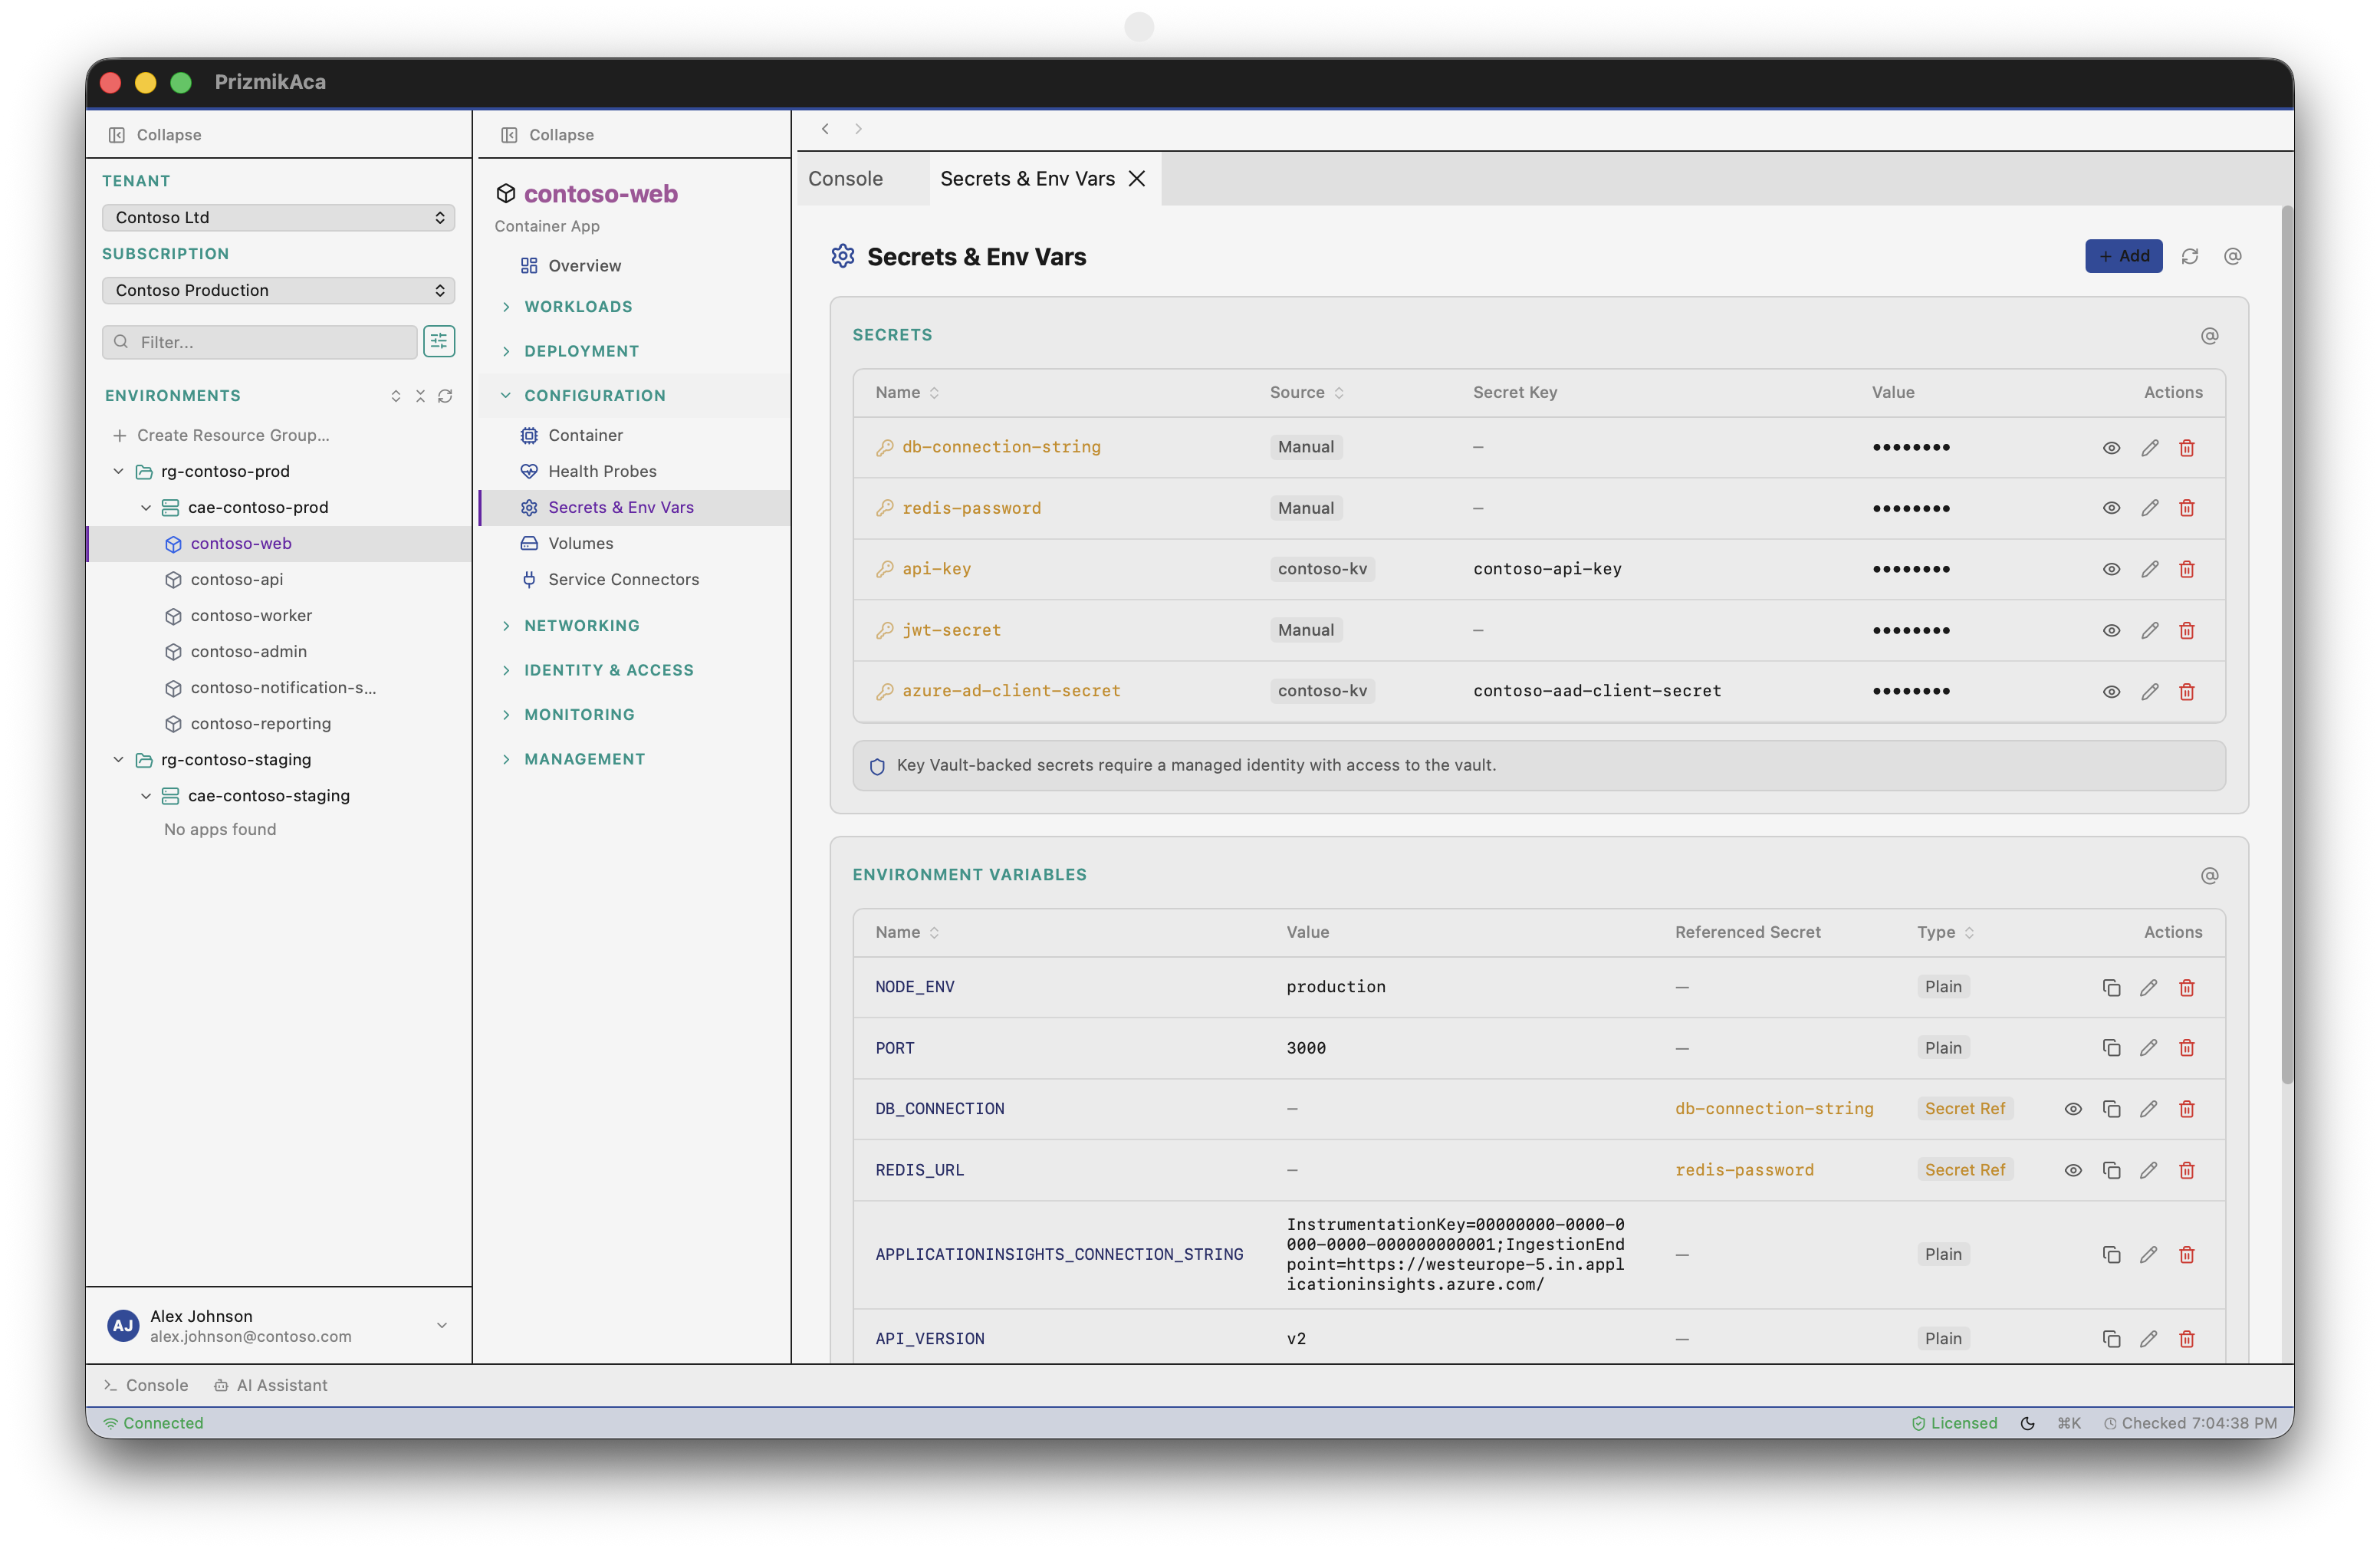
5. Get a One-Click Security Audit
The Portal leaves security headers up to you. Are you setting the right security headers on your web app? Stop guessing. Prizmik gives you a one-click audit that checks for HSTS, CSP, and more, complete with suggestions on how to fix any gaps.
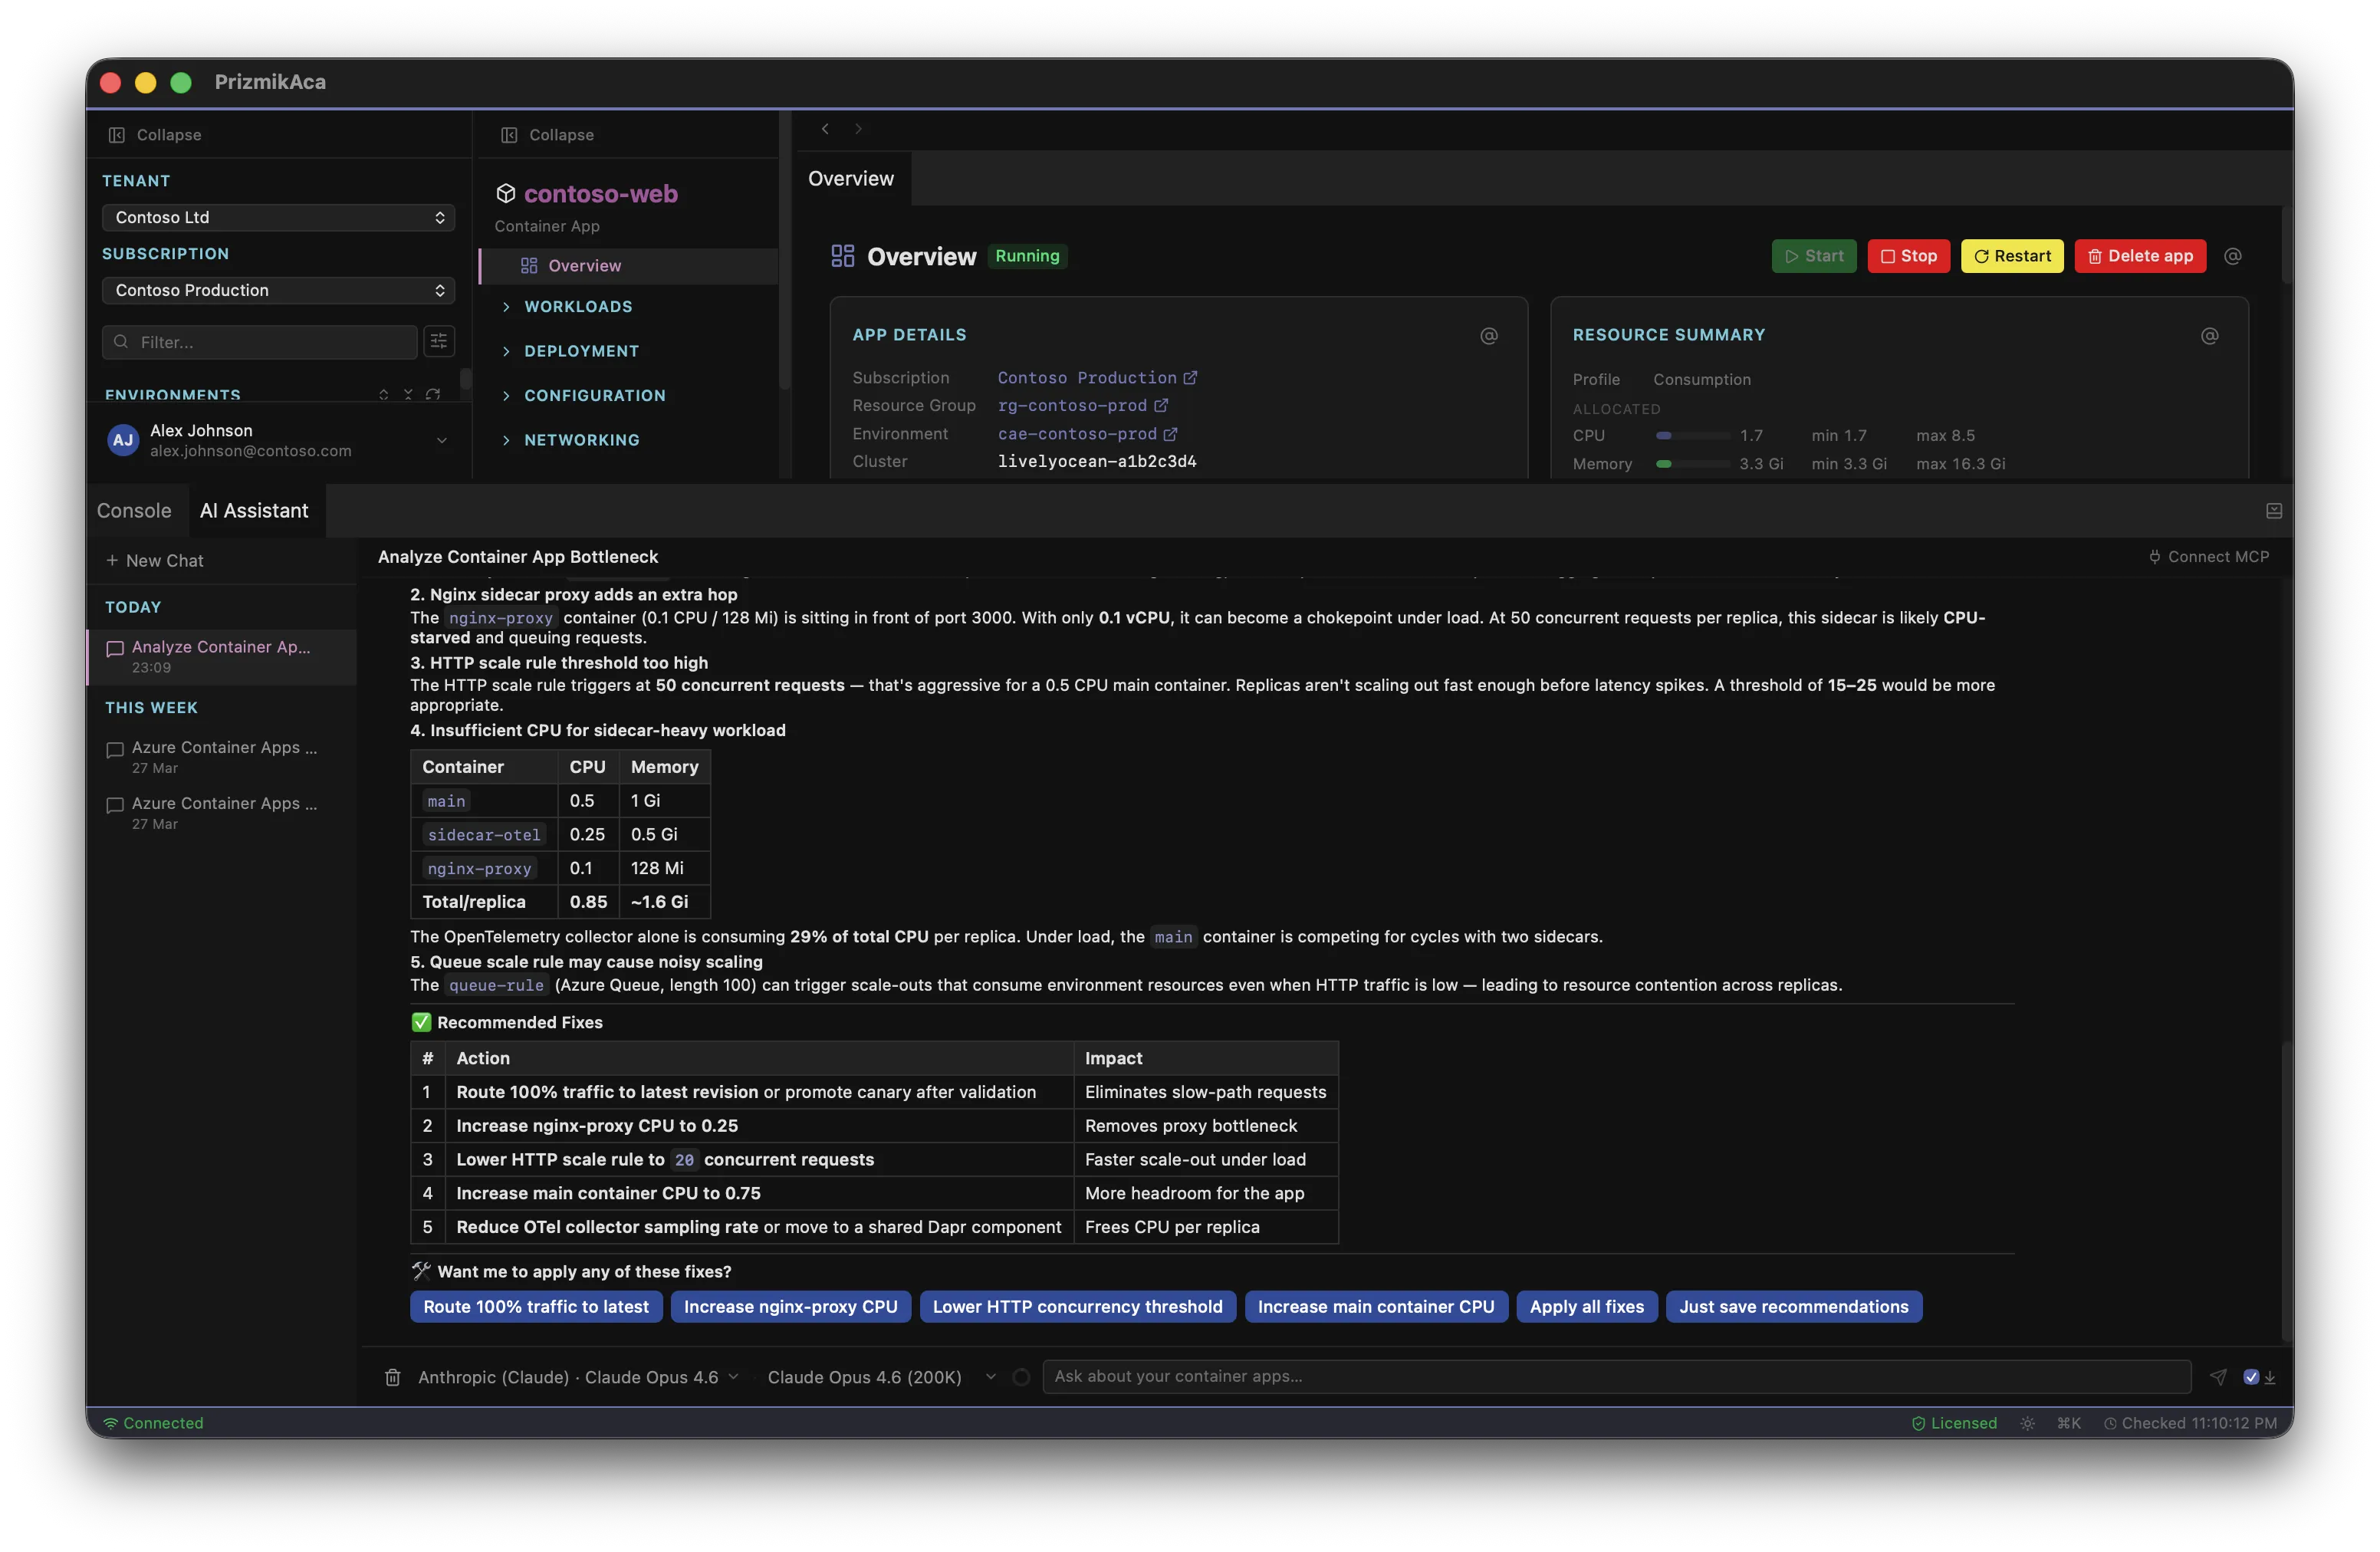
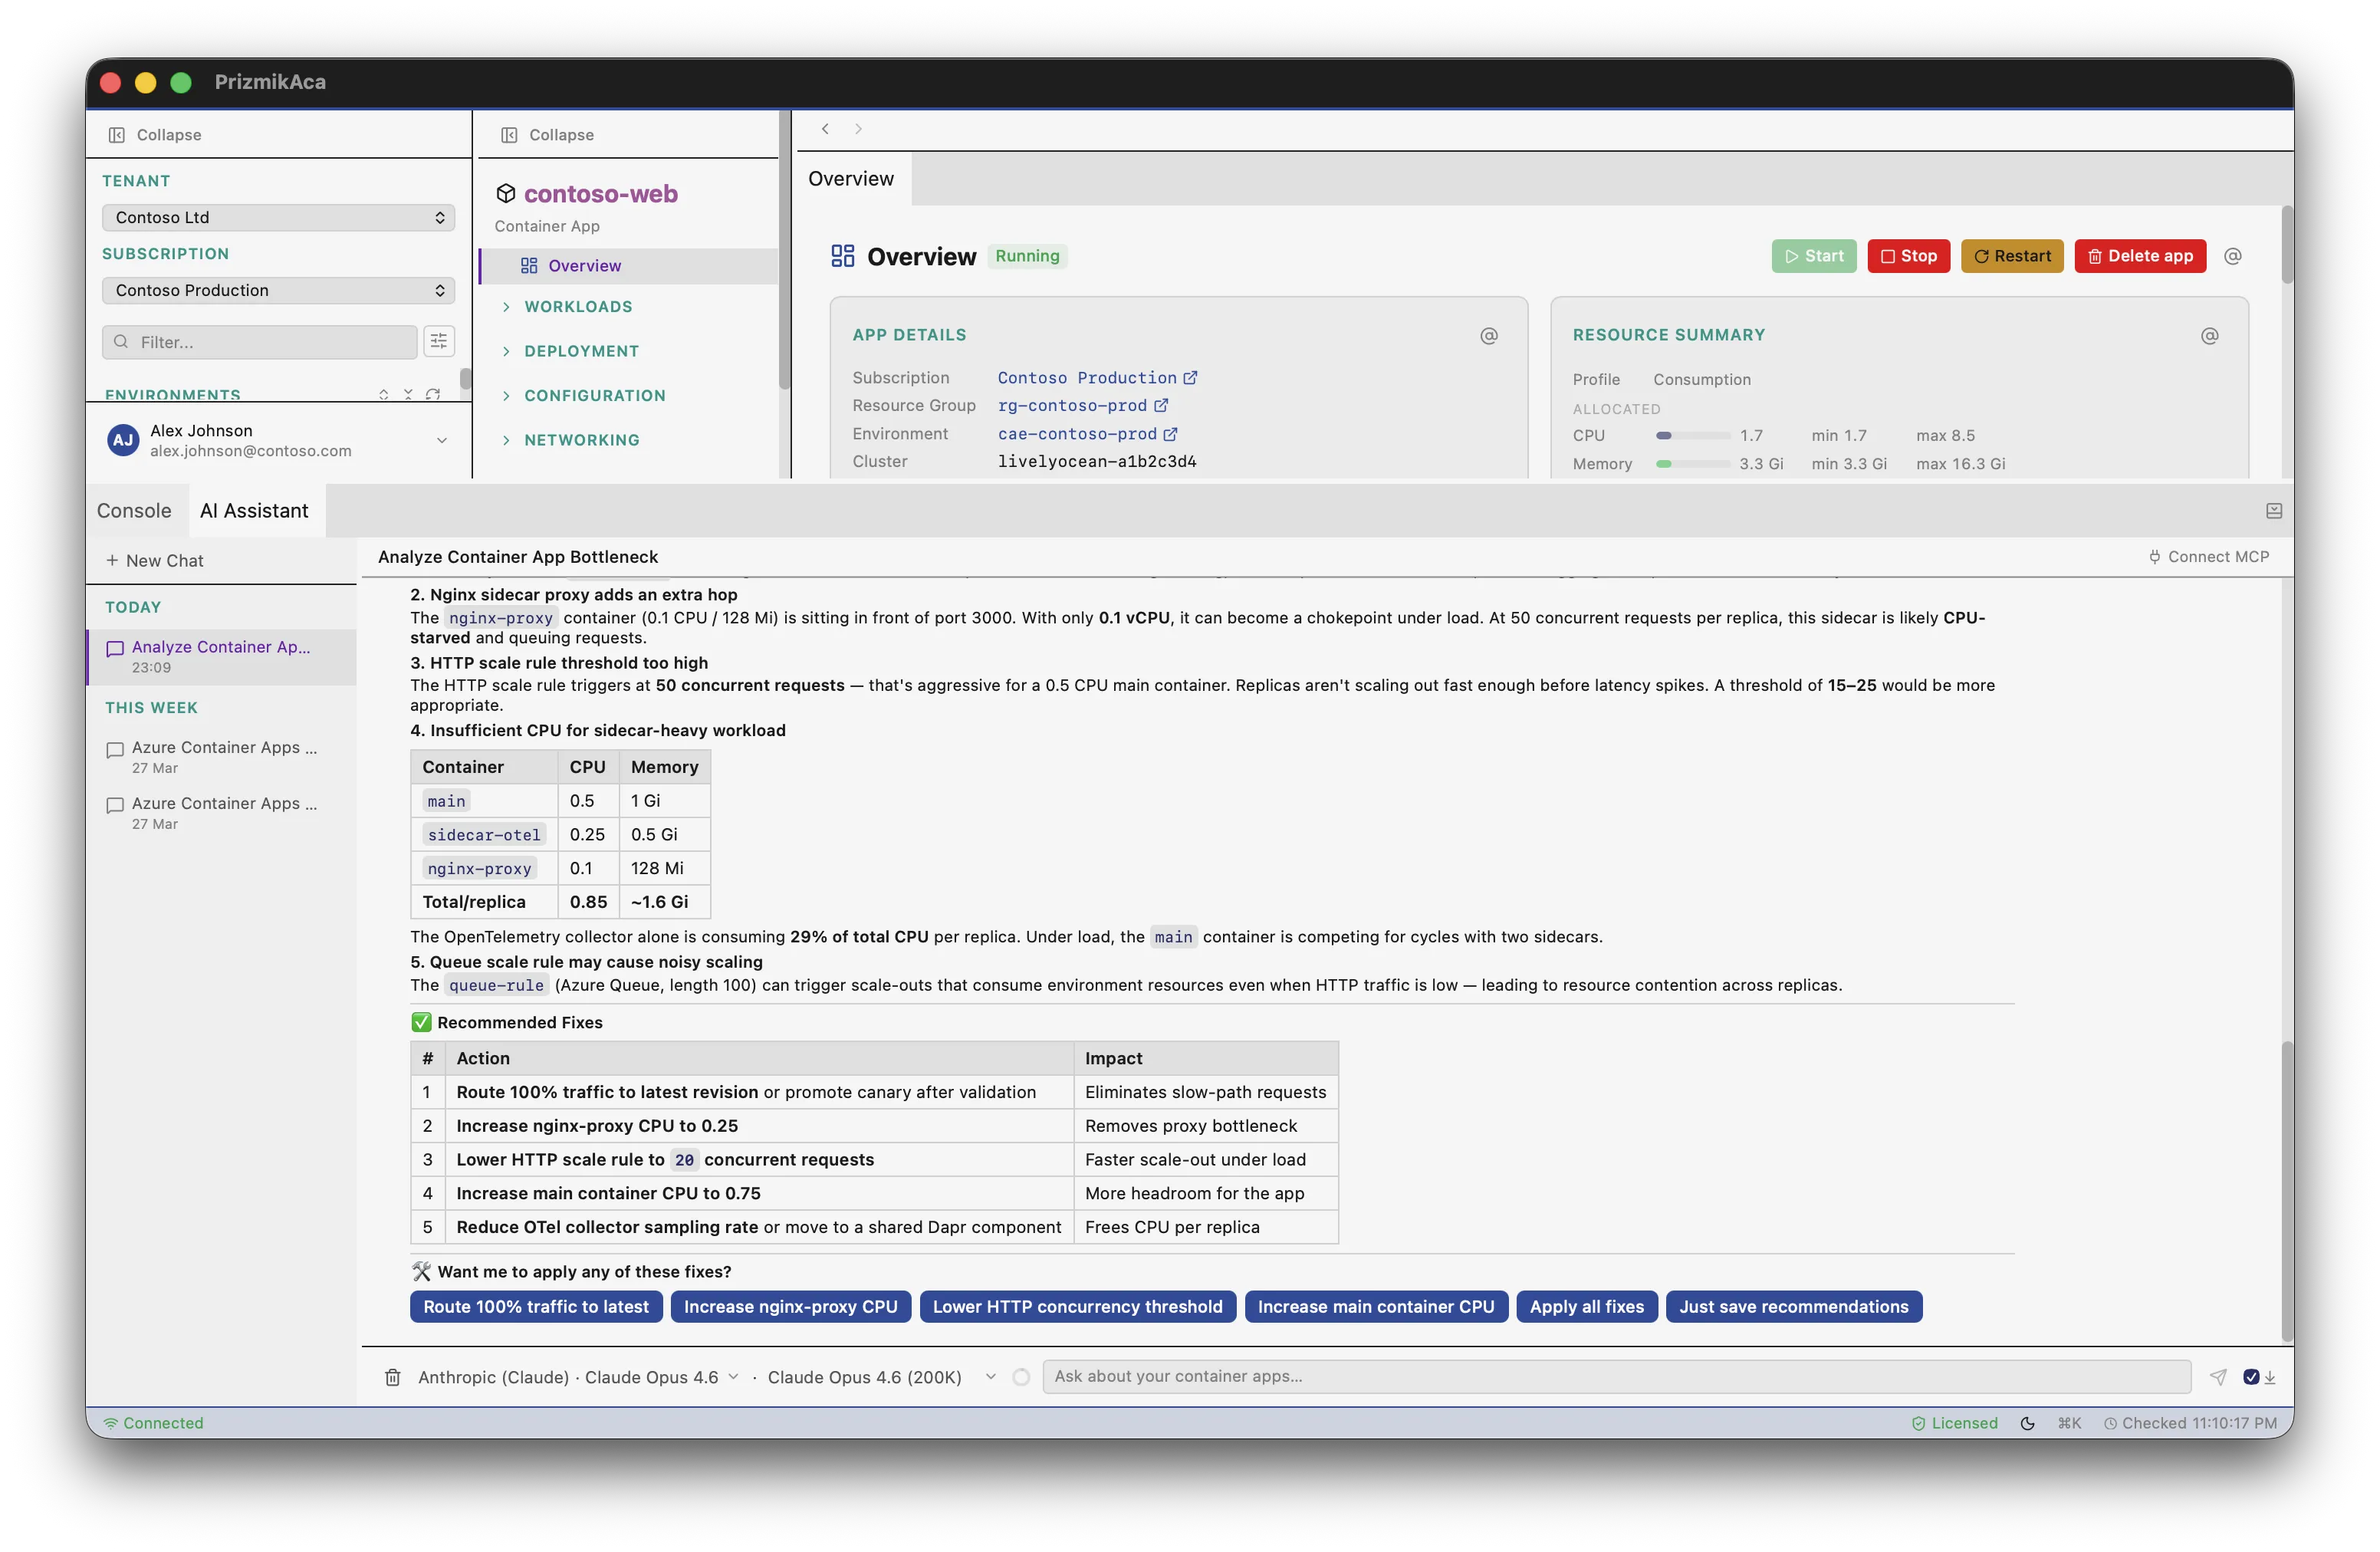
6. Use an AI That Does, Not Just Suggests
The Portal's AI is a consultant. It suggests CLI commands for you to run. Prizmik's AI is a teammate. With over 60 executable tools, it doesn't just suggest; it acts. Ask it to change a scaling rule, and it drafts the change for your approval. It's the hands-on help you've always wanted.
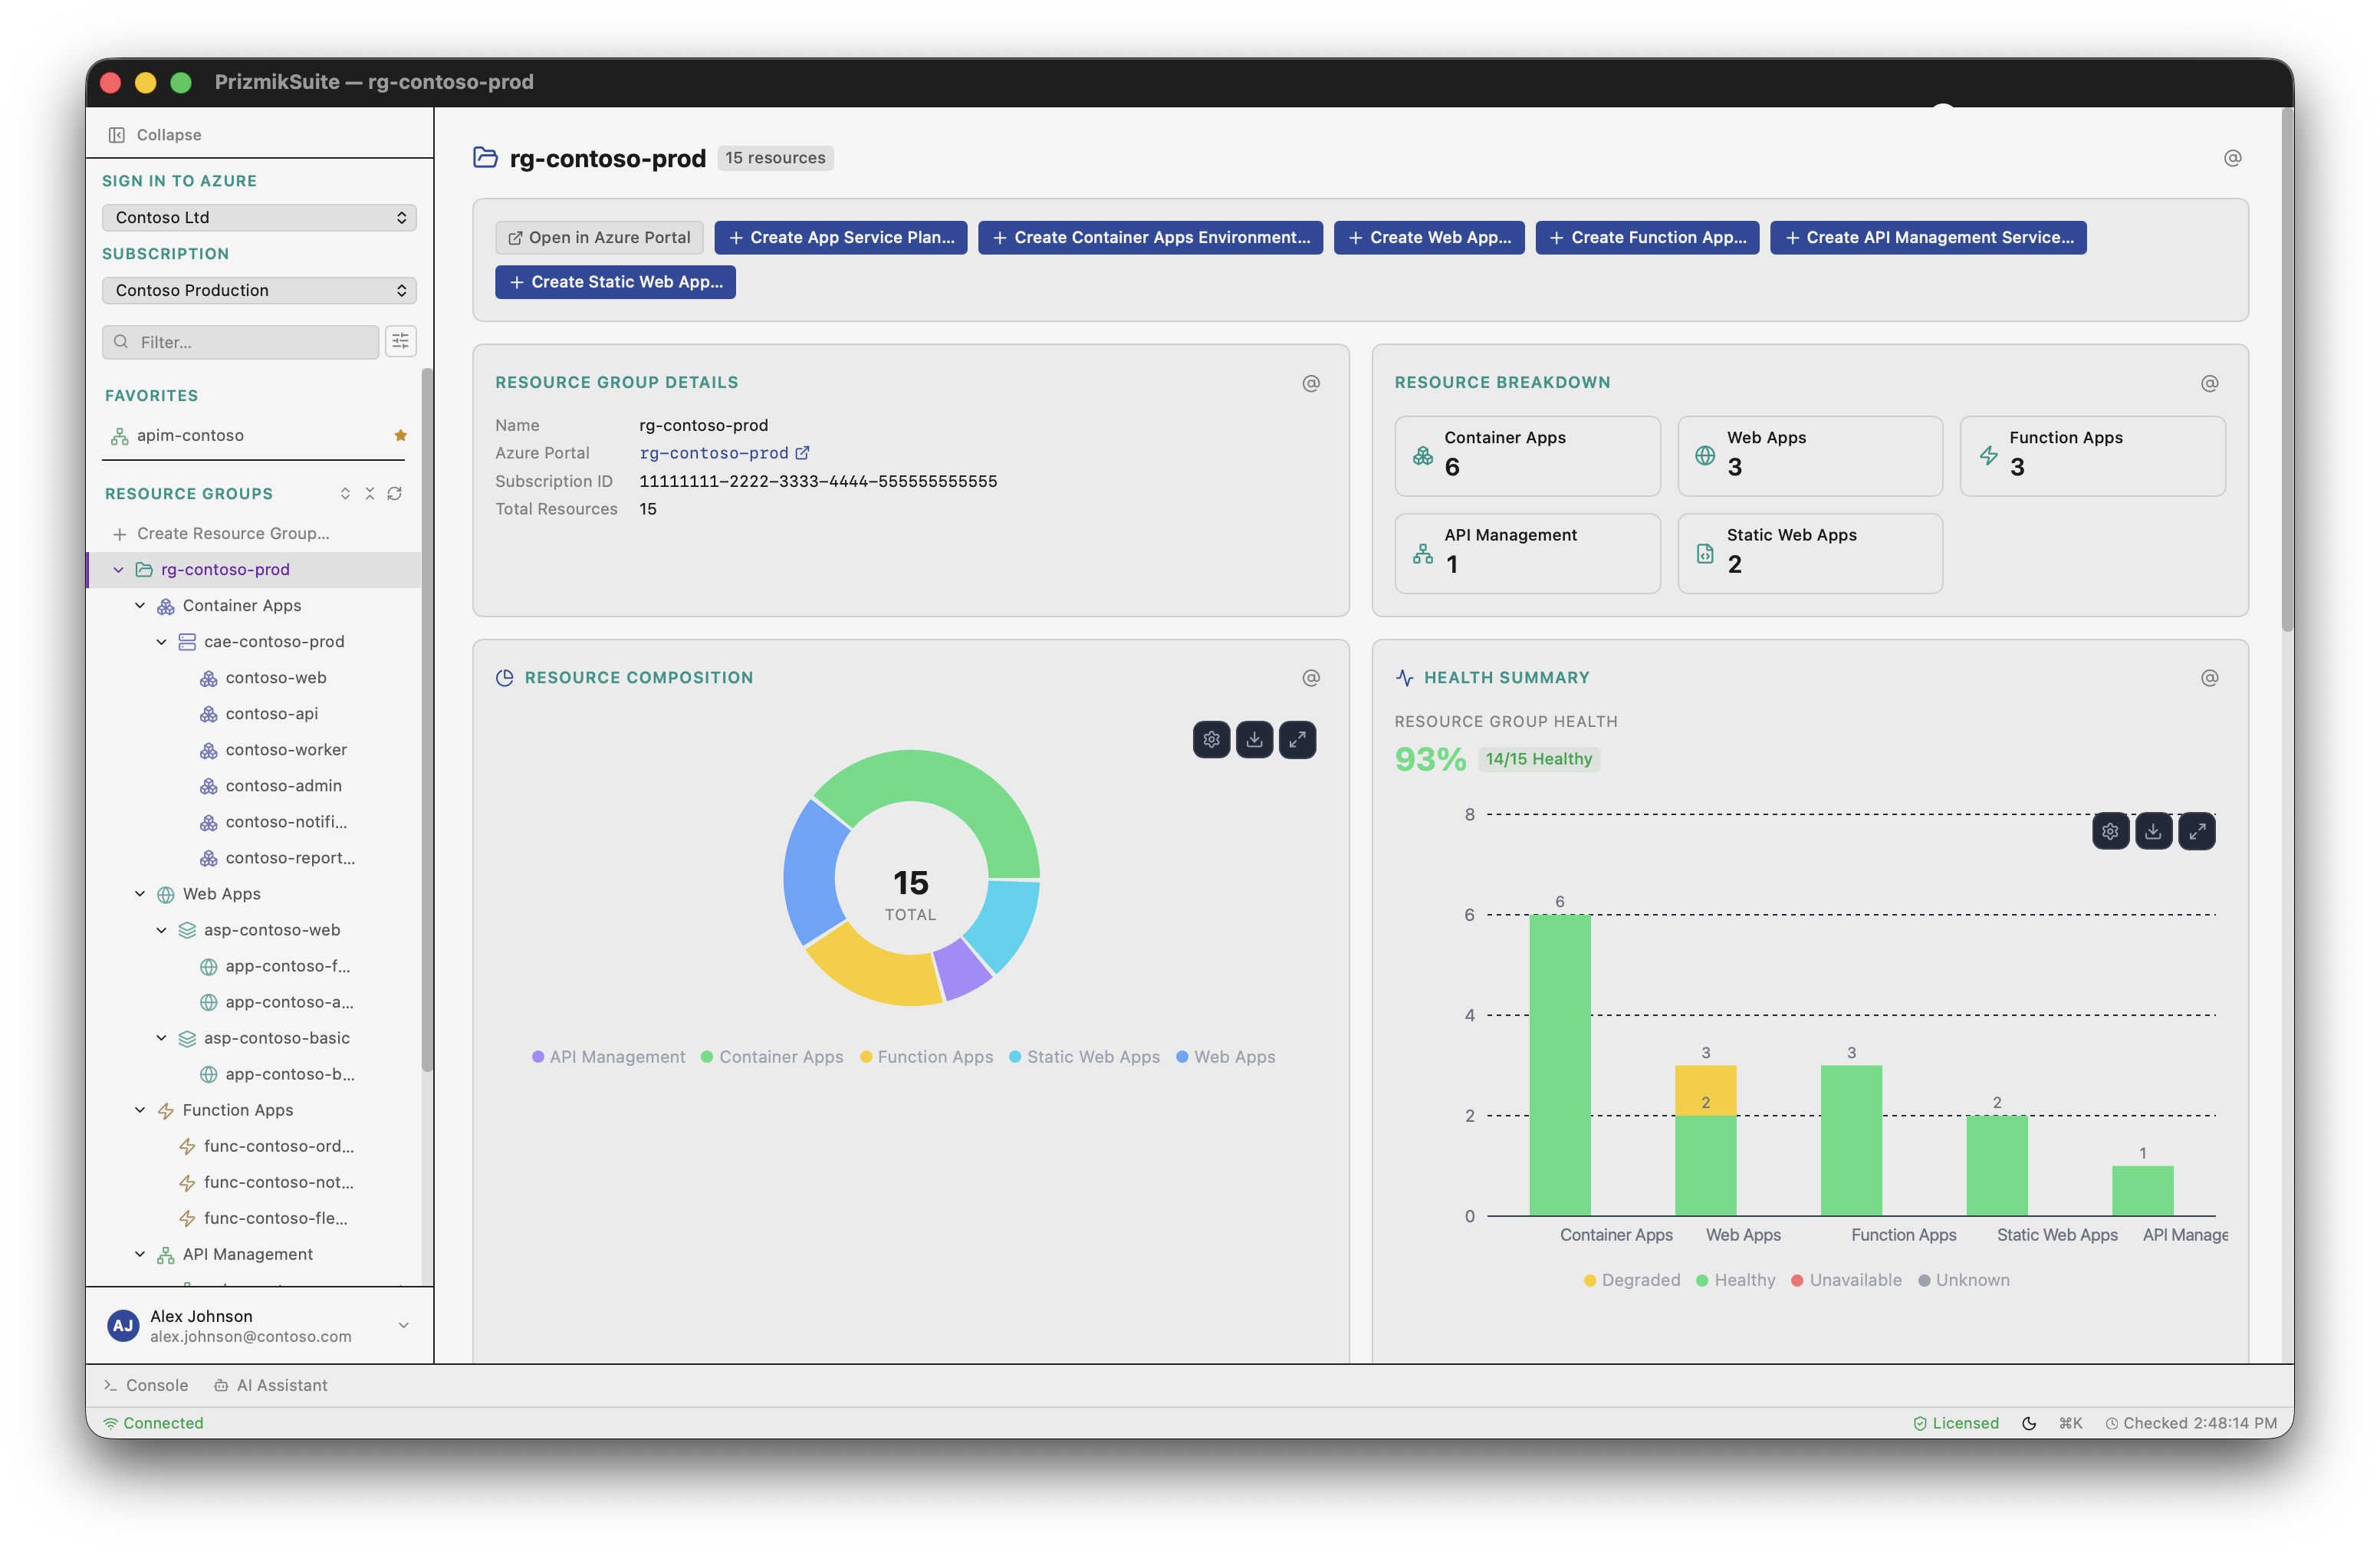
7. Build Your Own Mission Control
The Portal shows you one thing at a time. Debugging often requires correlating information from multiple places. Prizmik's split-panel view lets you build your own dashboard. Put your metrics on the left, your logs on the right, and your AI assistant at the bottom. It's your data, your way.
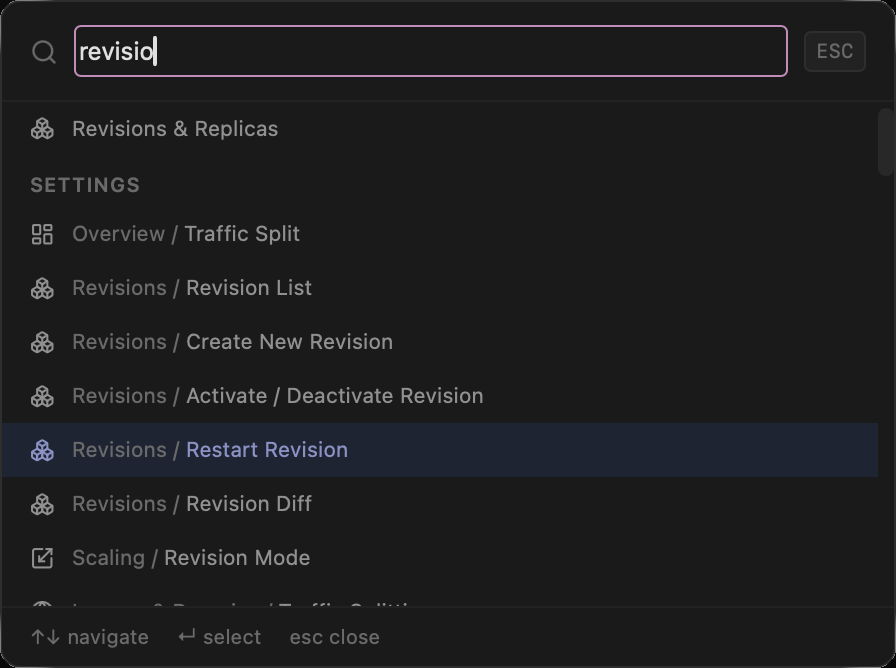
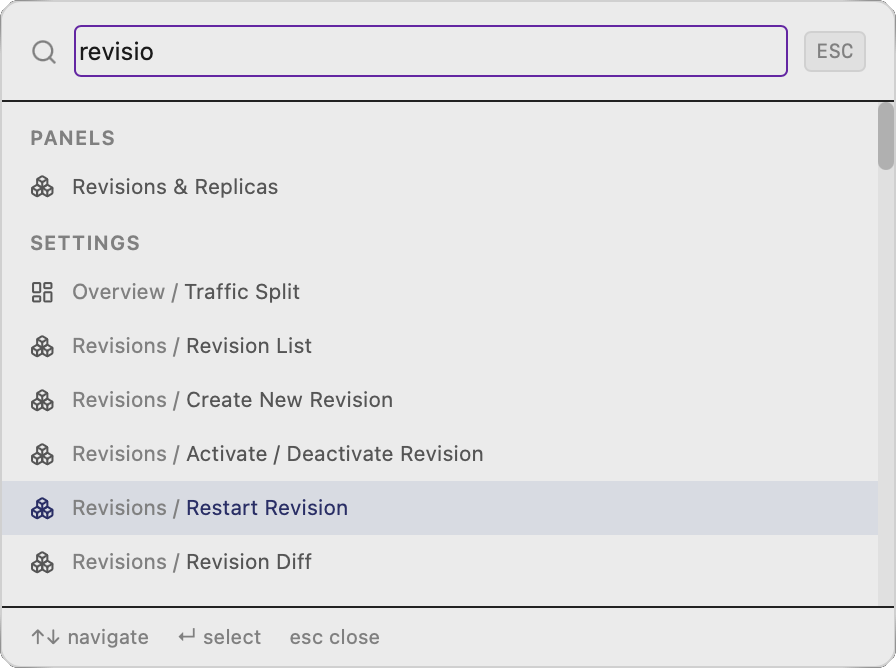
8. Move at the Speed of Thought
The Portal is a world of clicks. For power users, the mouse is a bottleneck. Prizmik's Command Palette lets you navigate your entire environment from the keyboard. Jump to any resource, open any panel, or run any action in milliseconds.
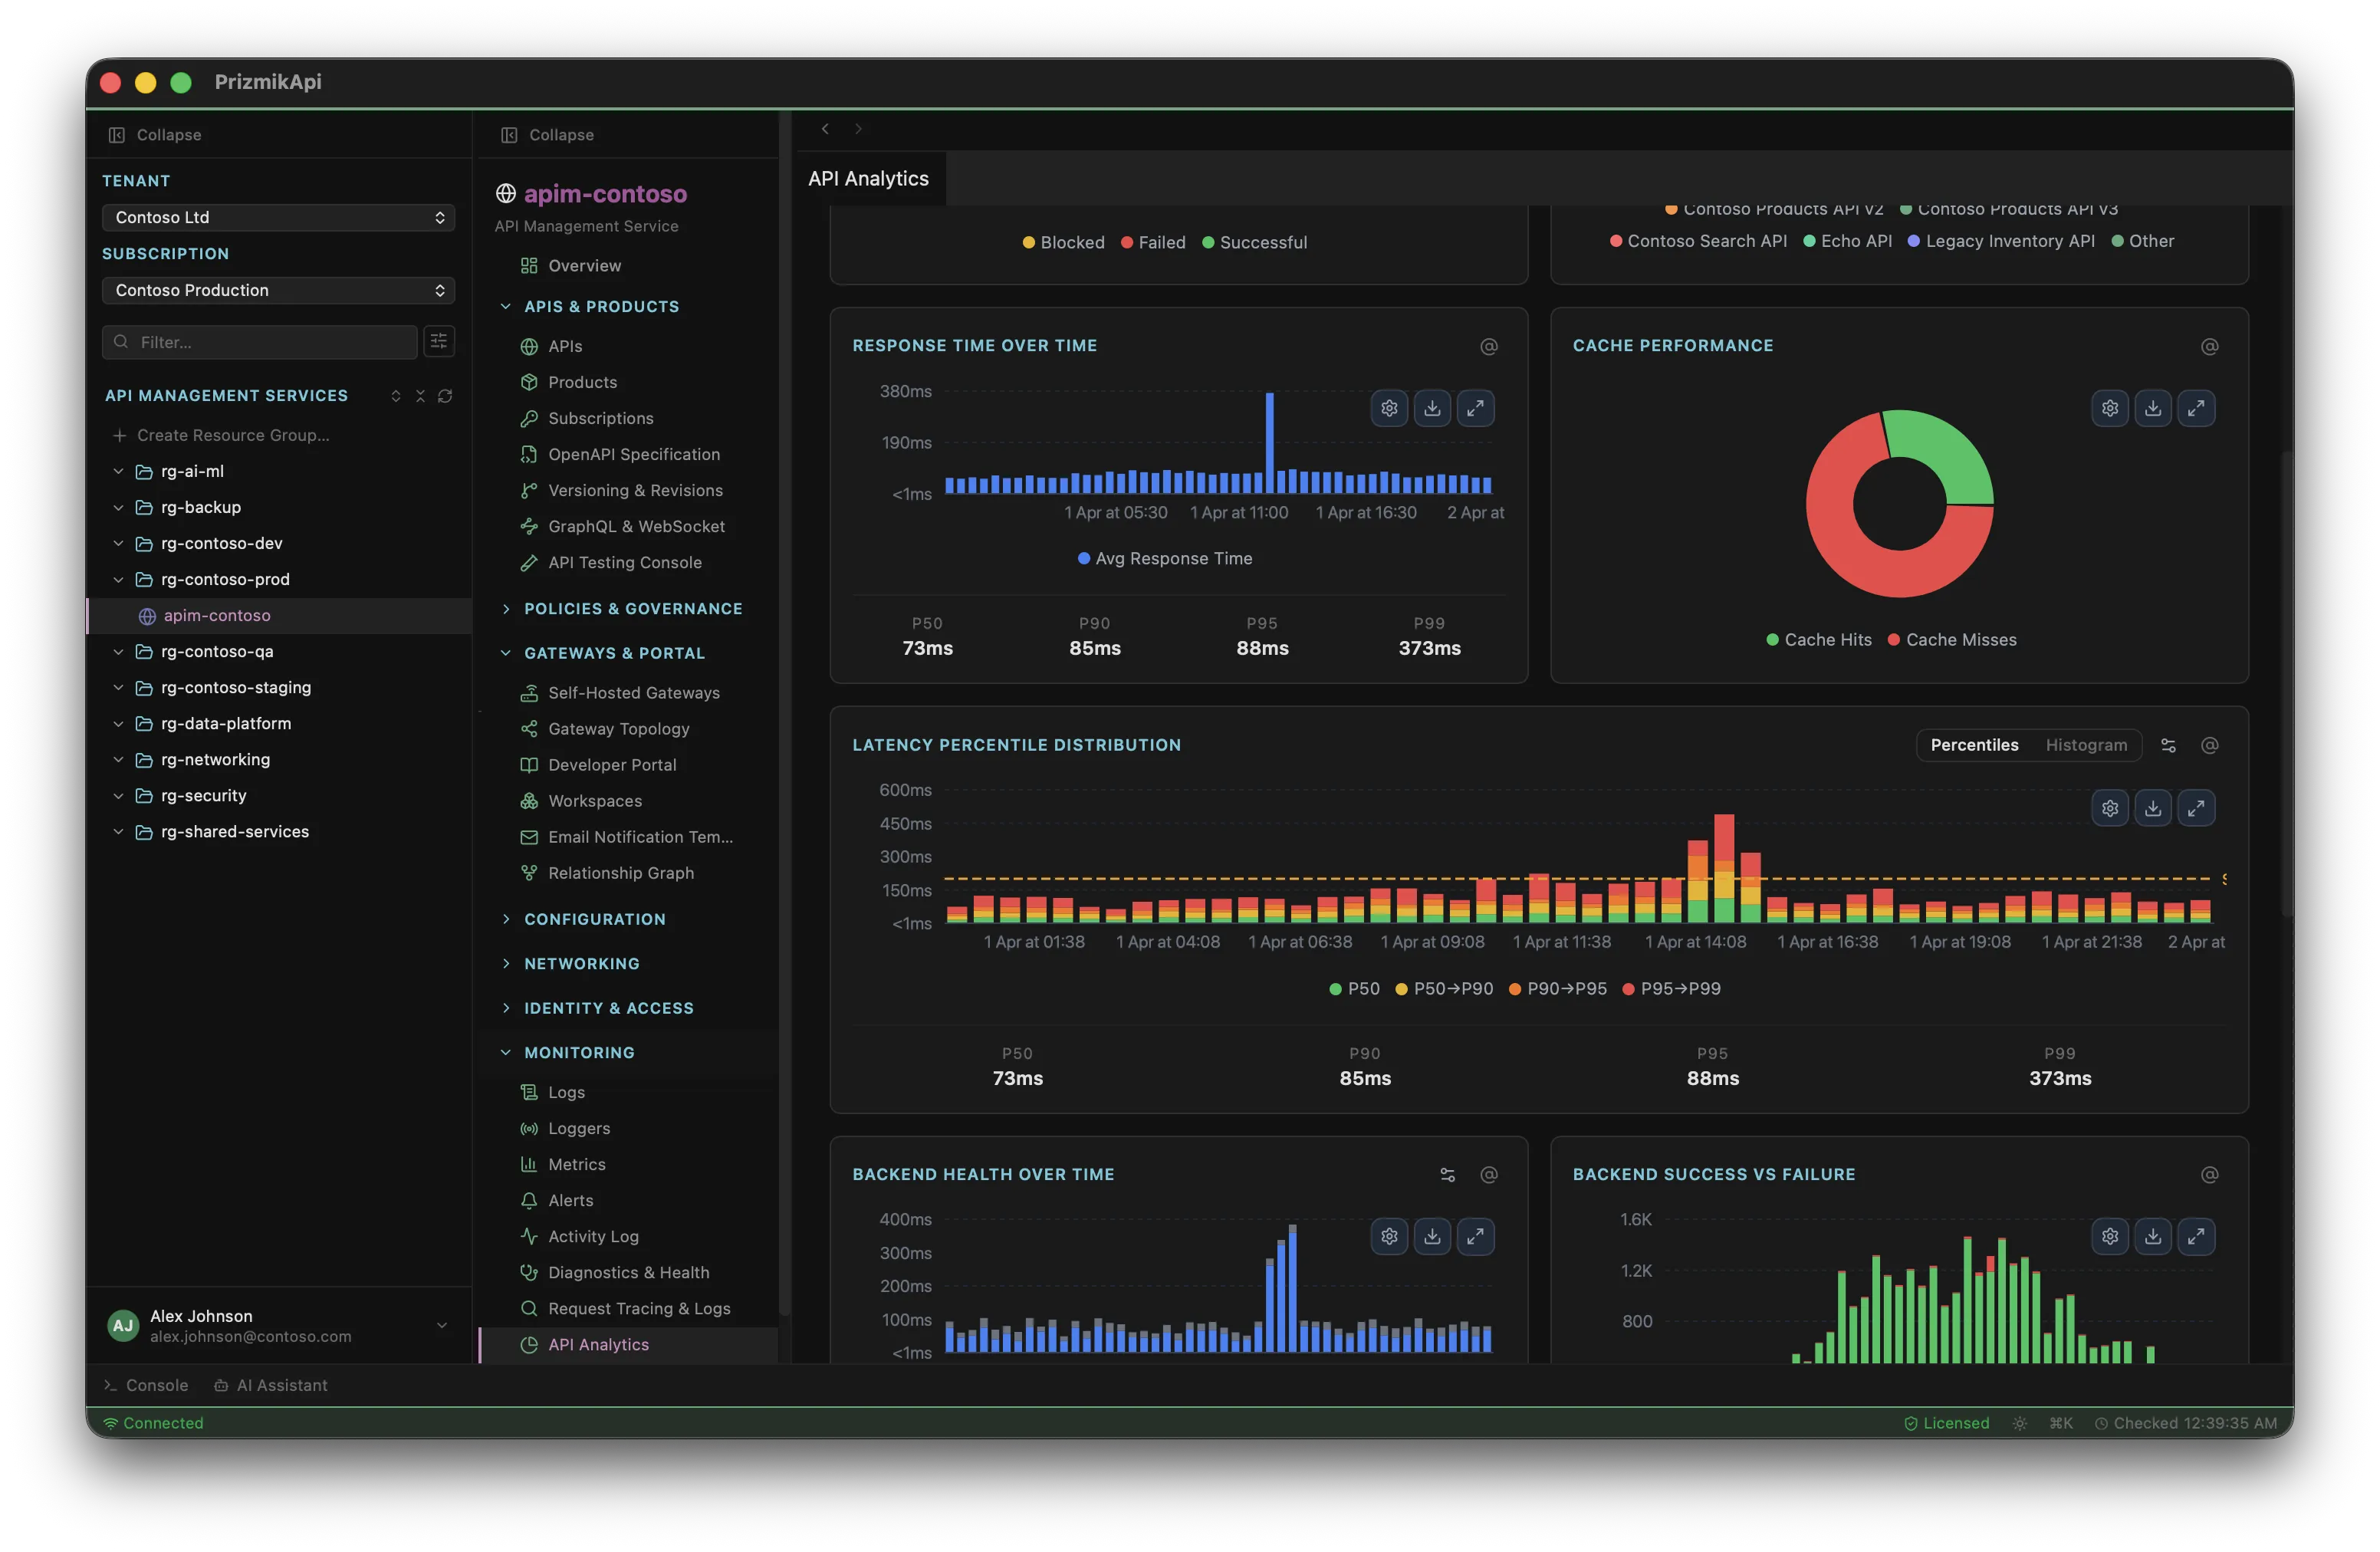
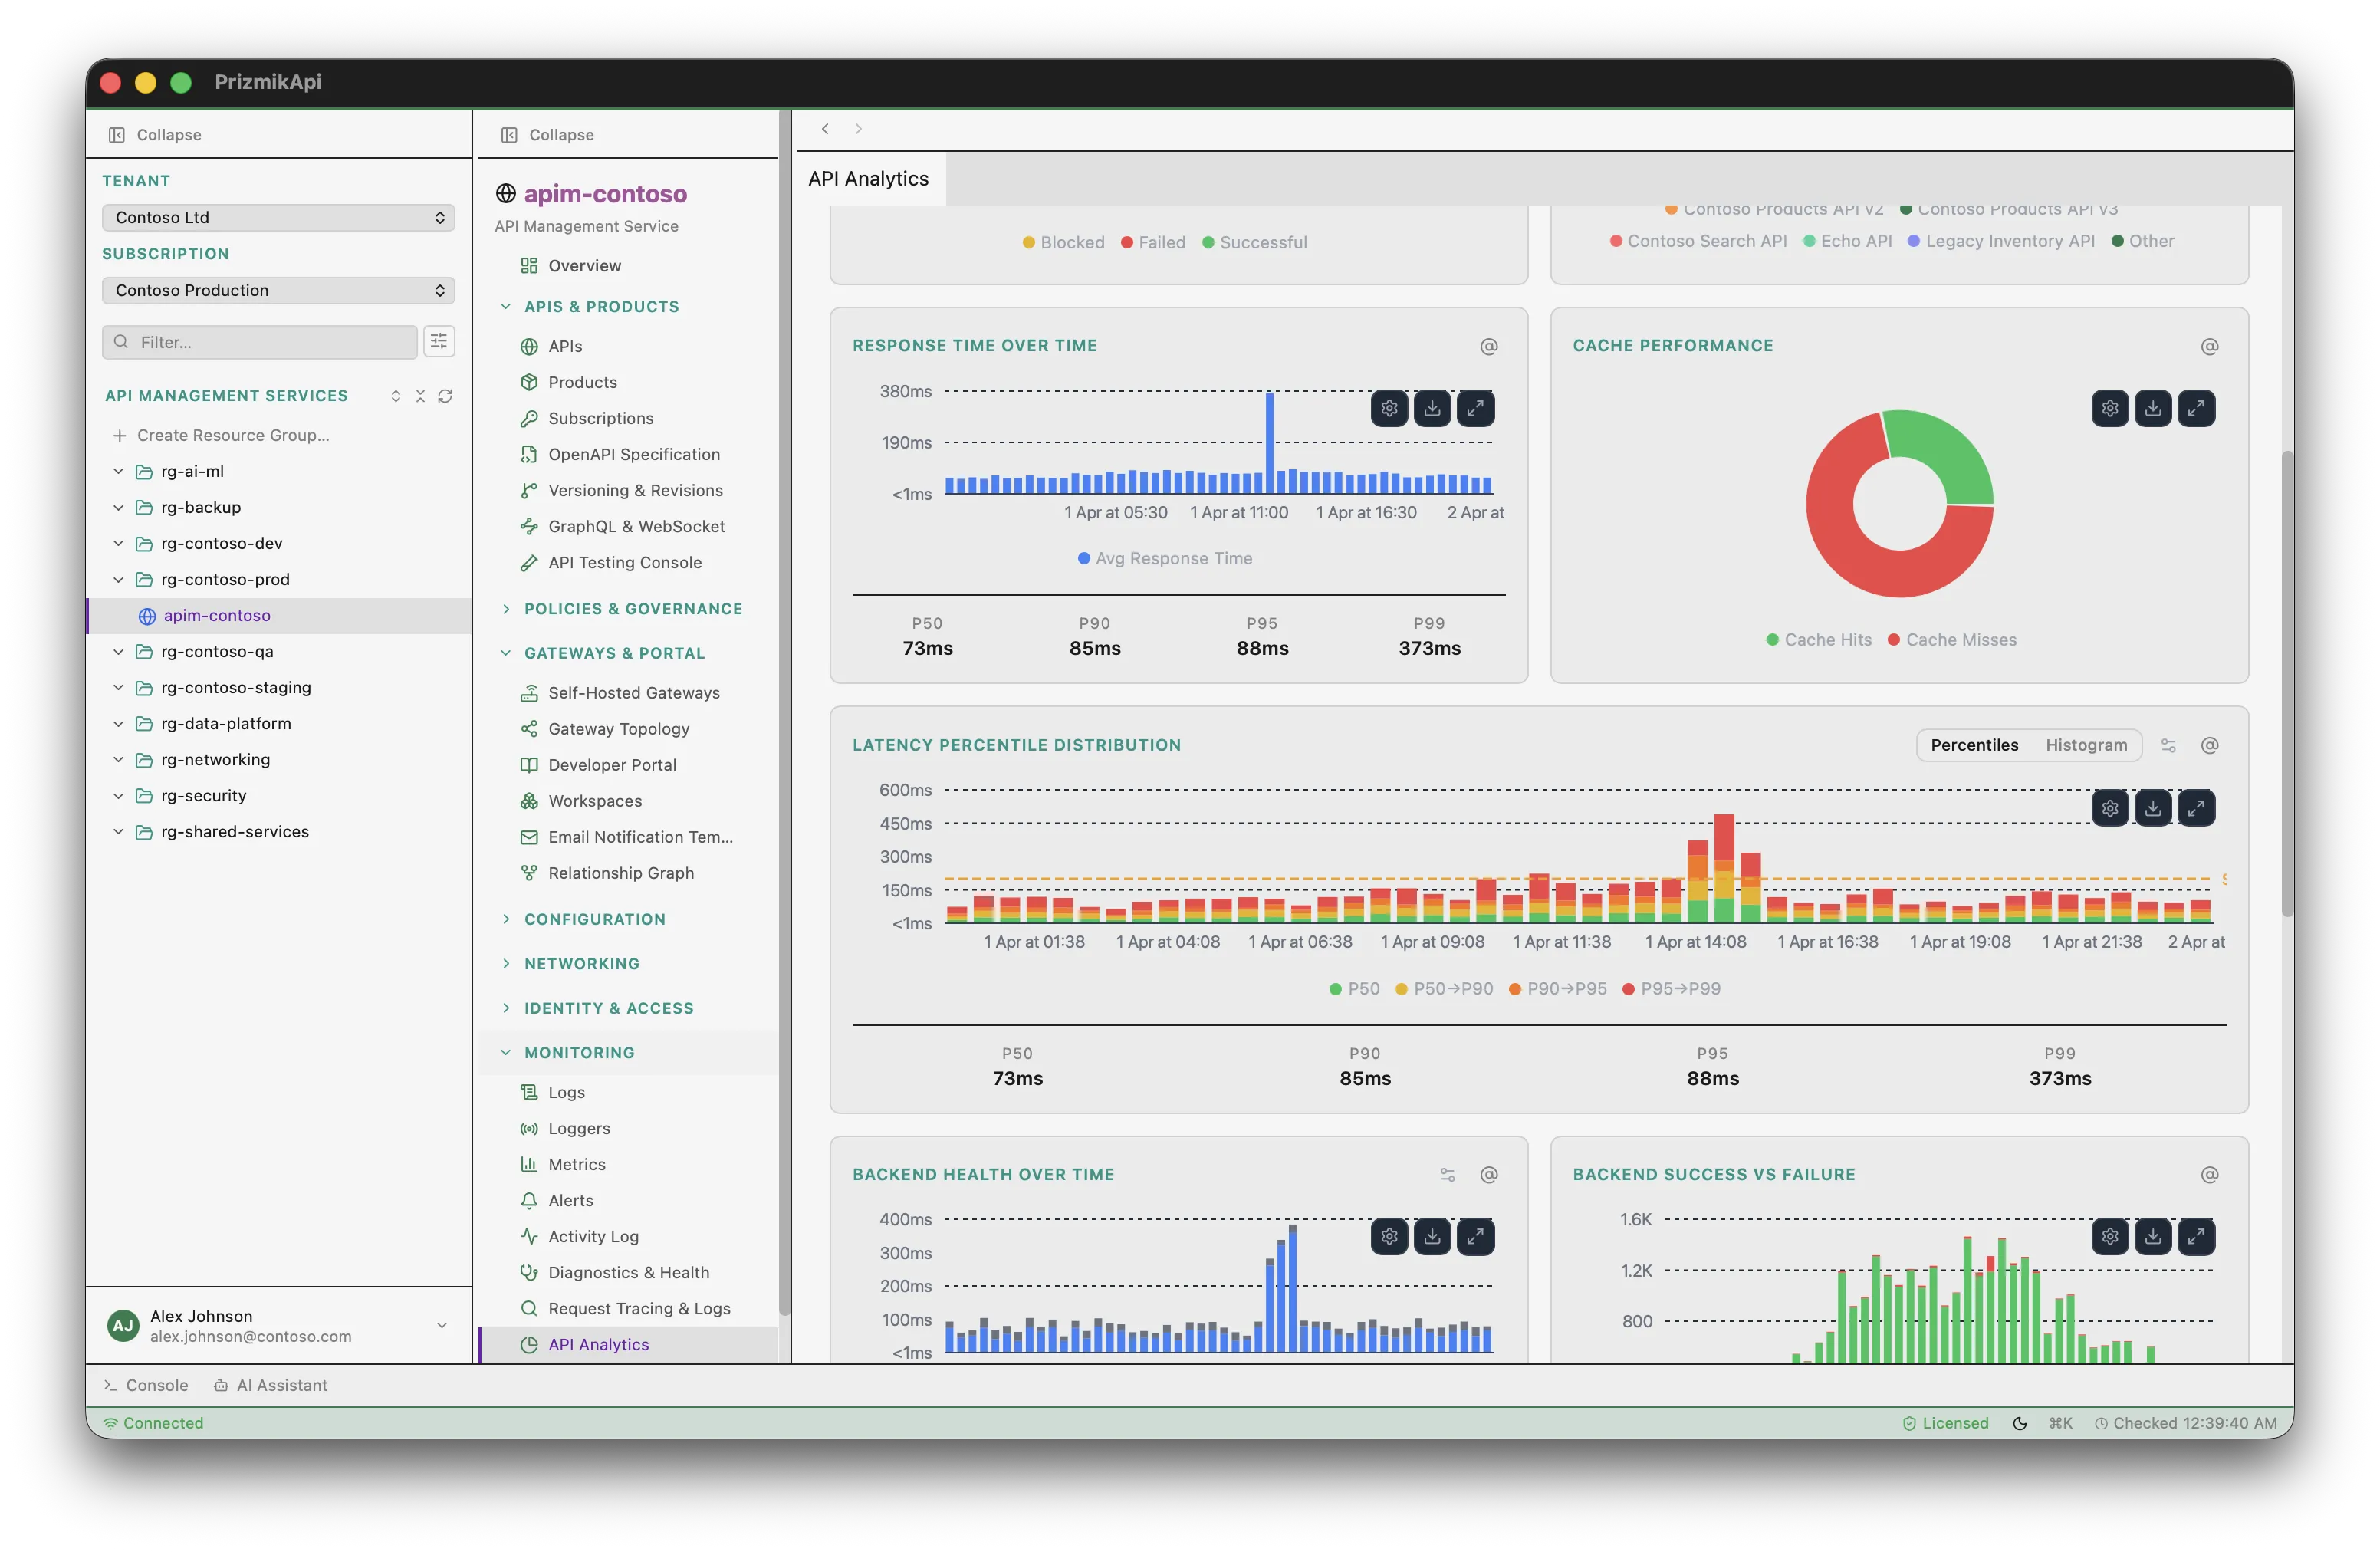
9. Let Your Data Tell a Story
The Portal gives you data points, not insights. Prizmik's API Analytics Dashboard is designed to tell a story. With rich, interactive charts, it helps you understand your API traffic patterns, not just look at numbers. It's the difference between a spreadsheet and a visualization.
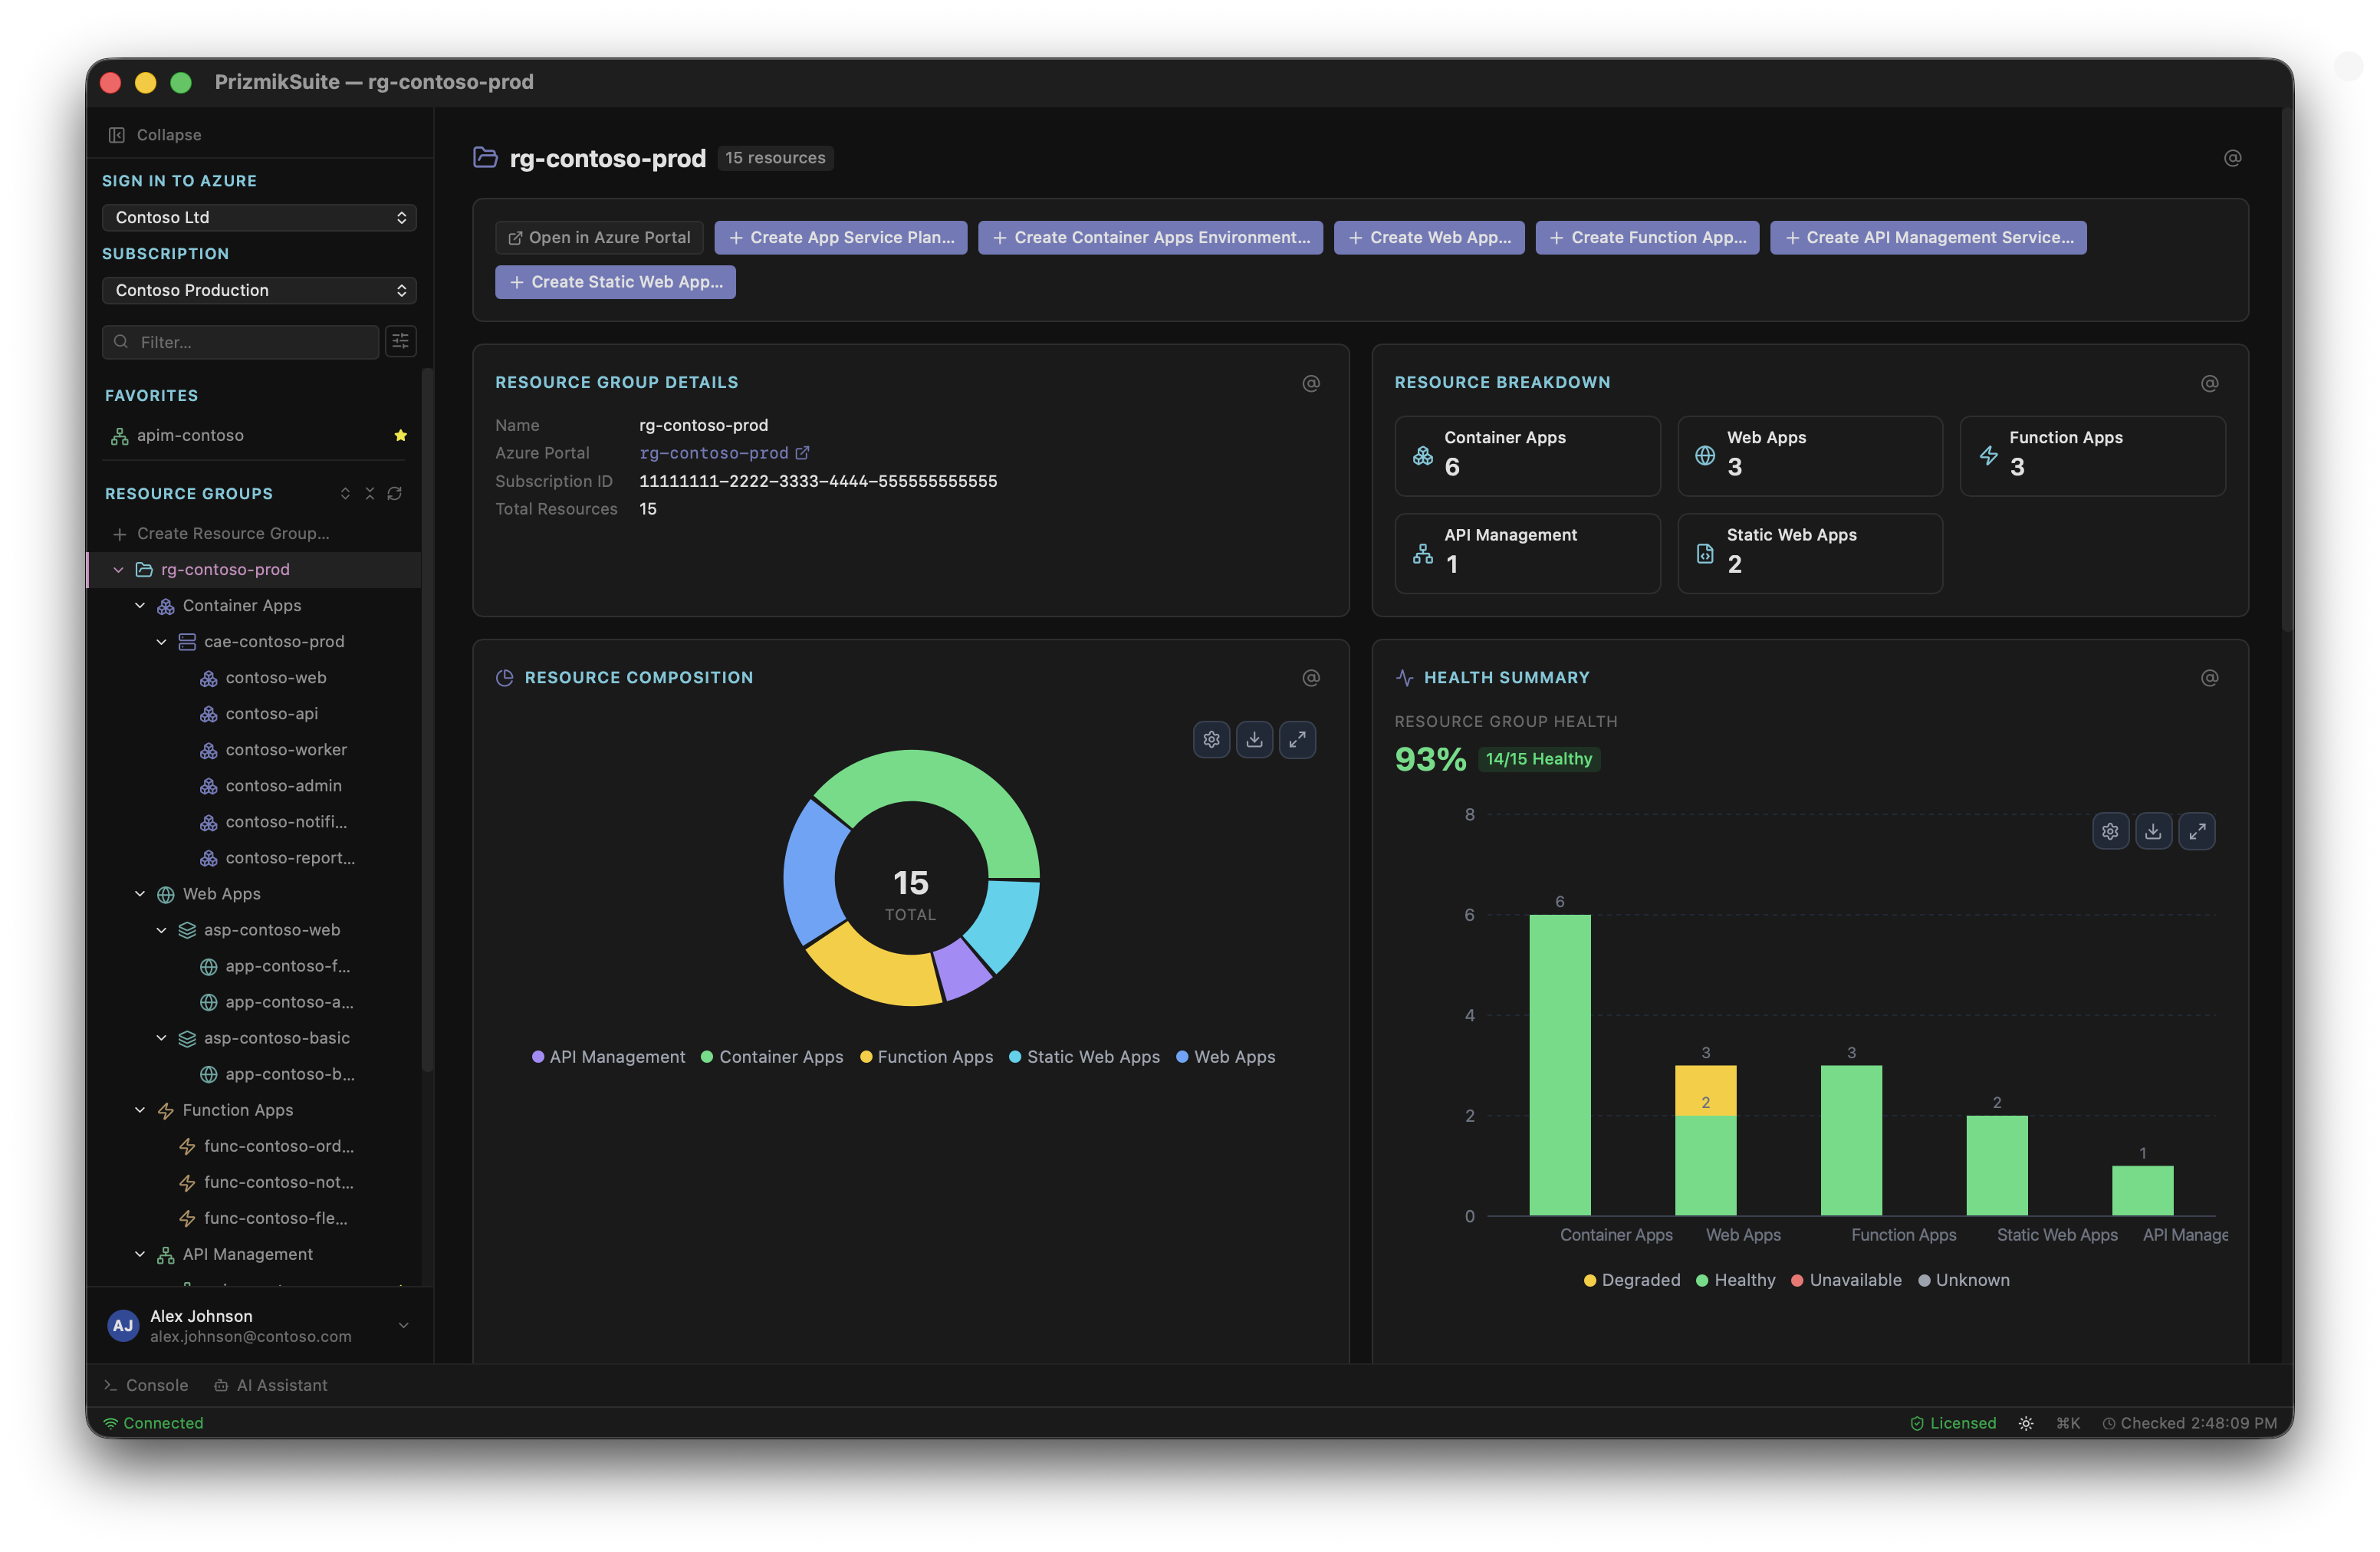
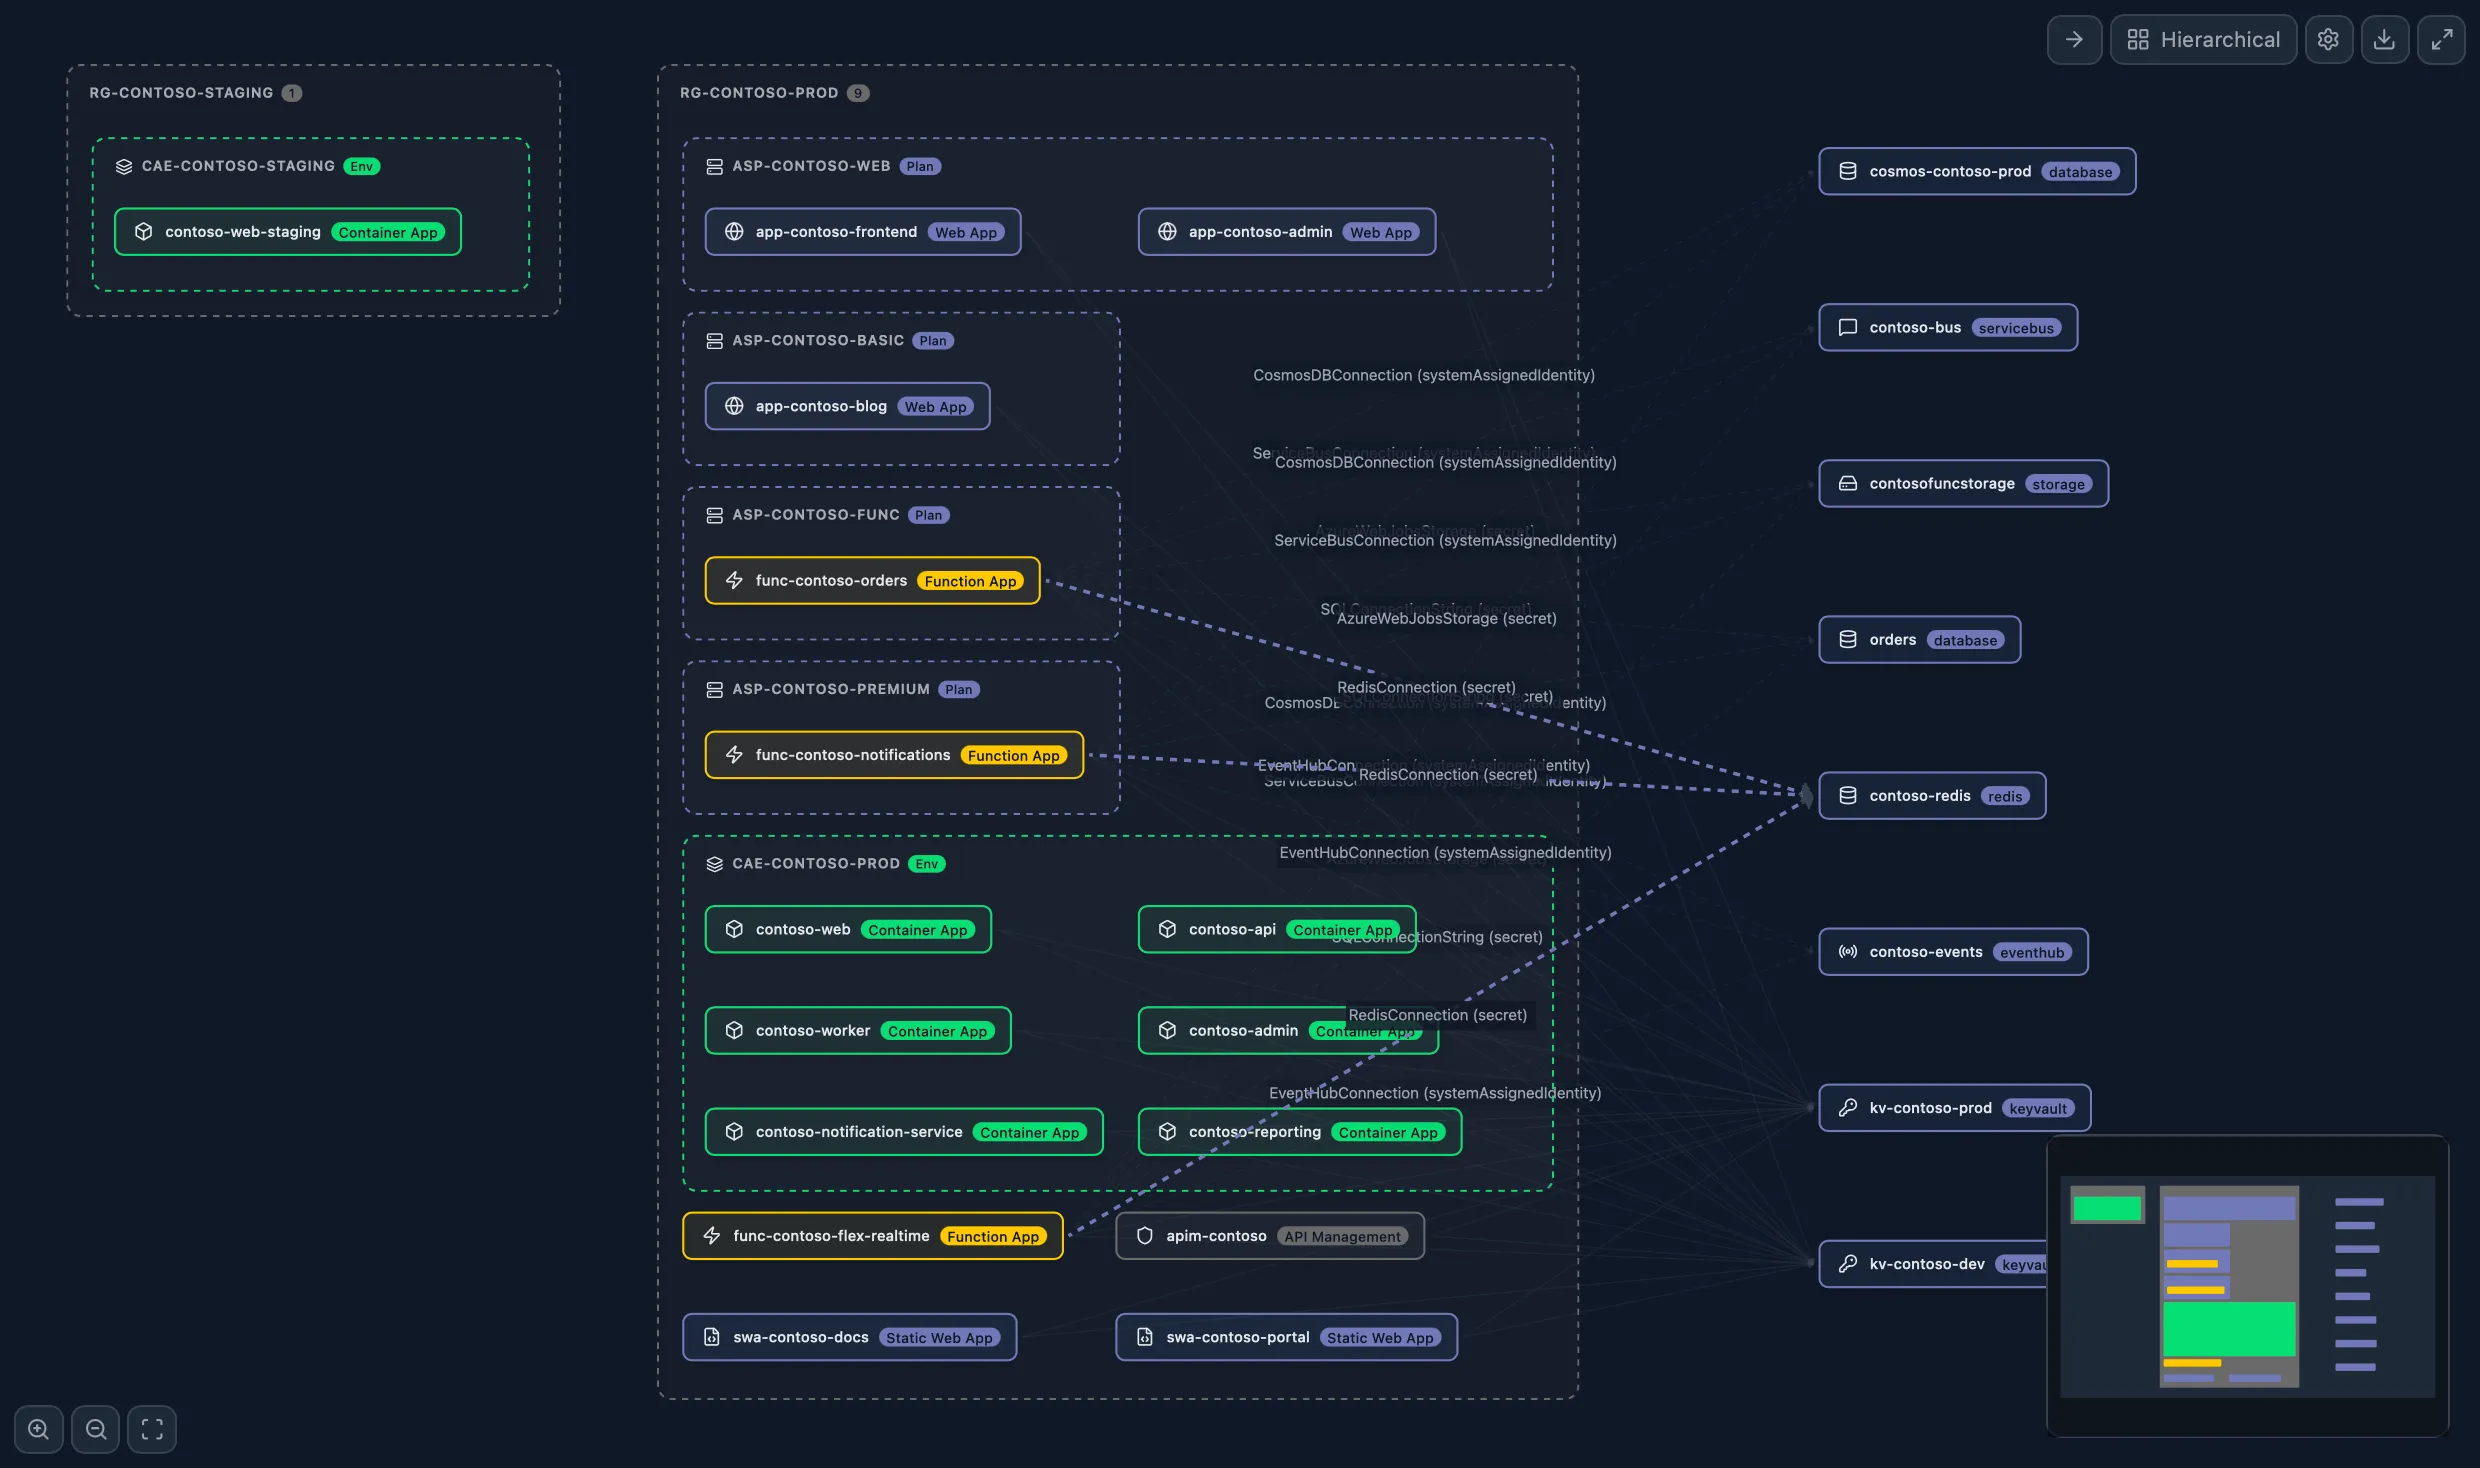
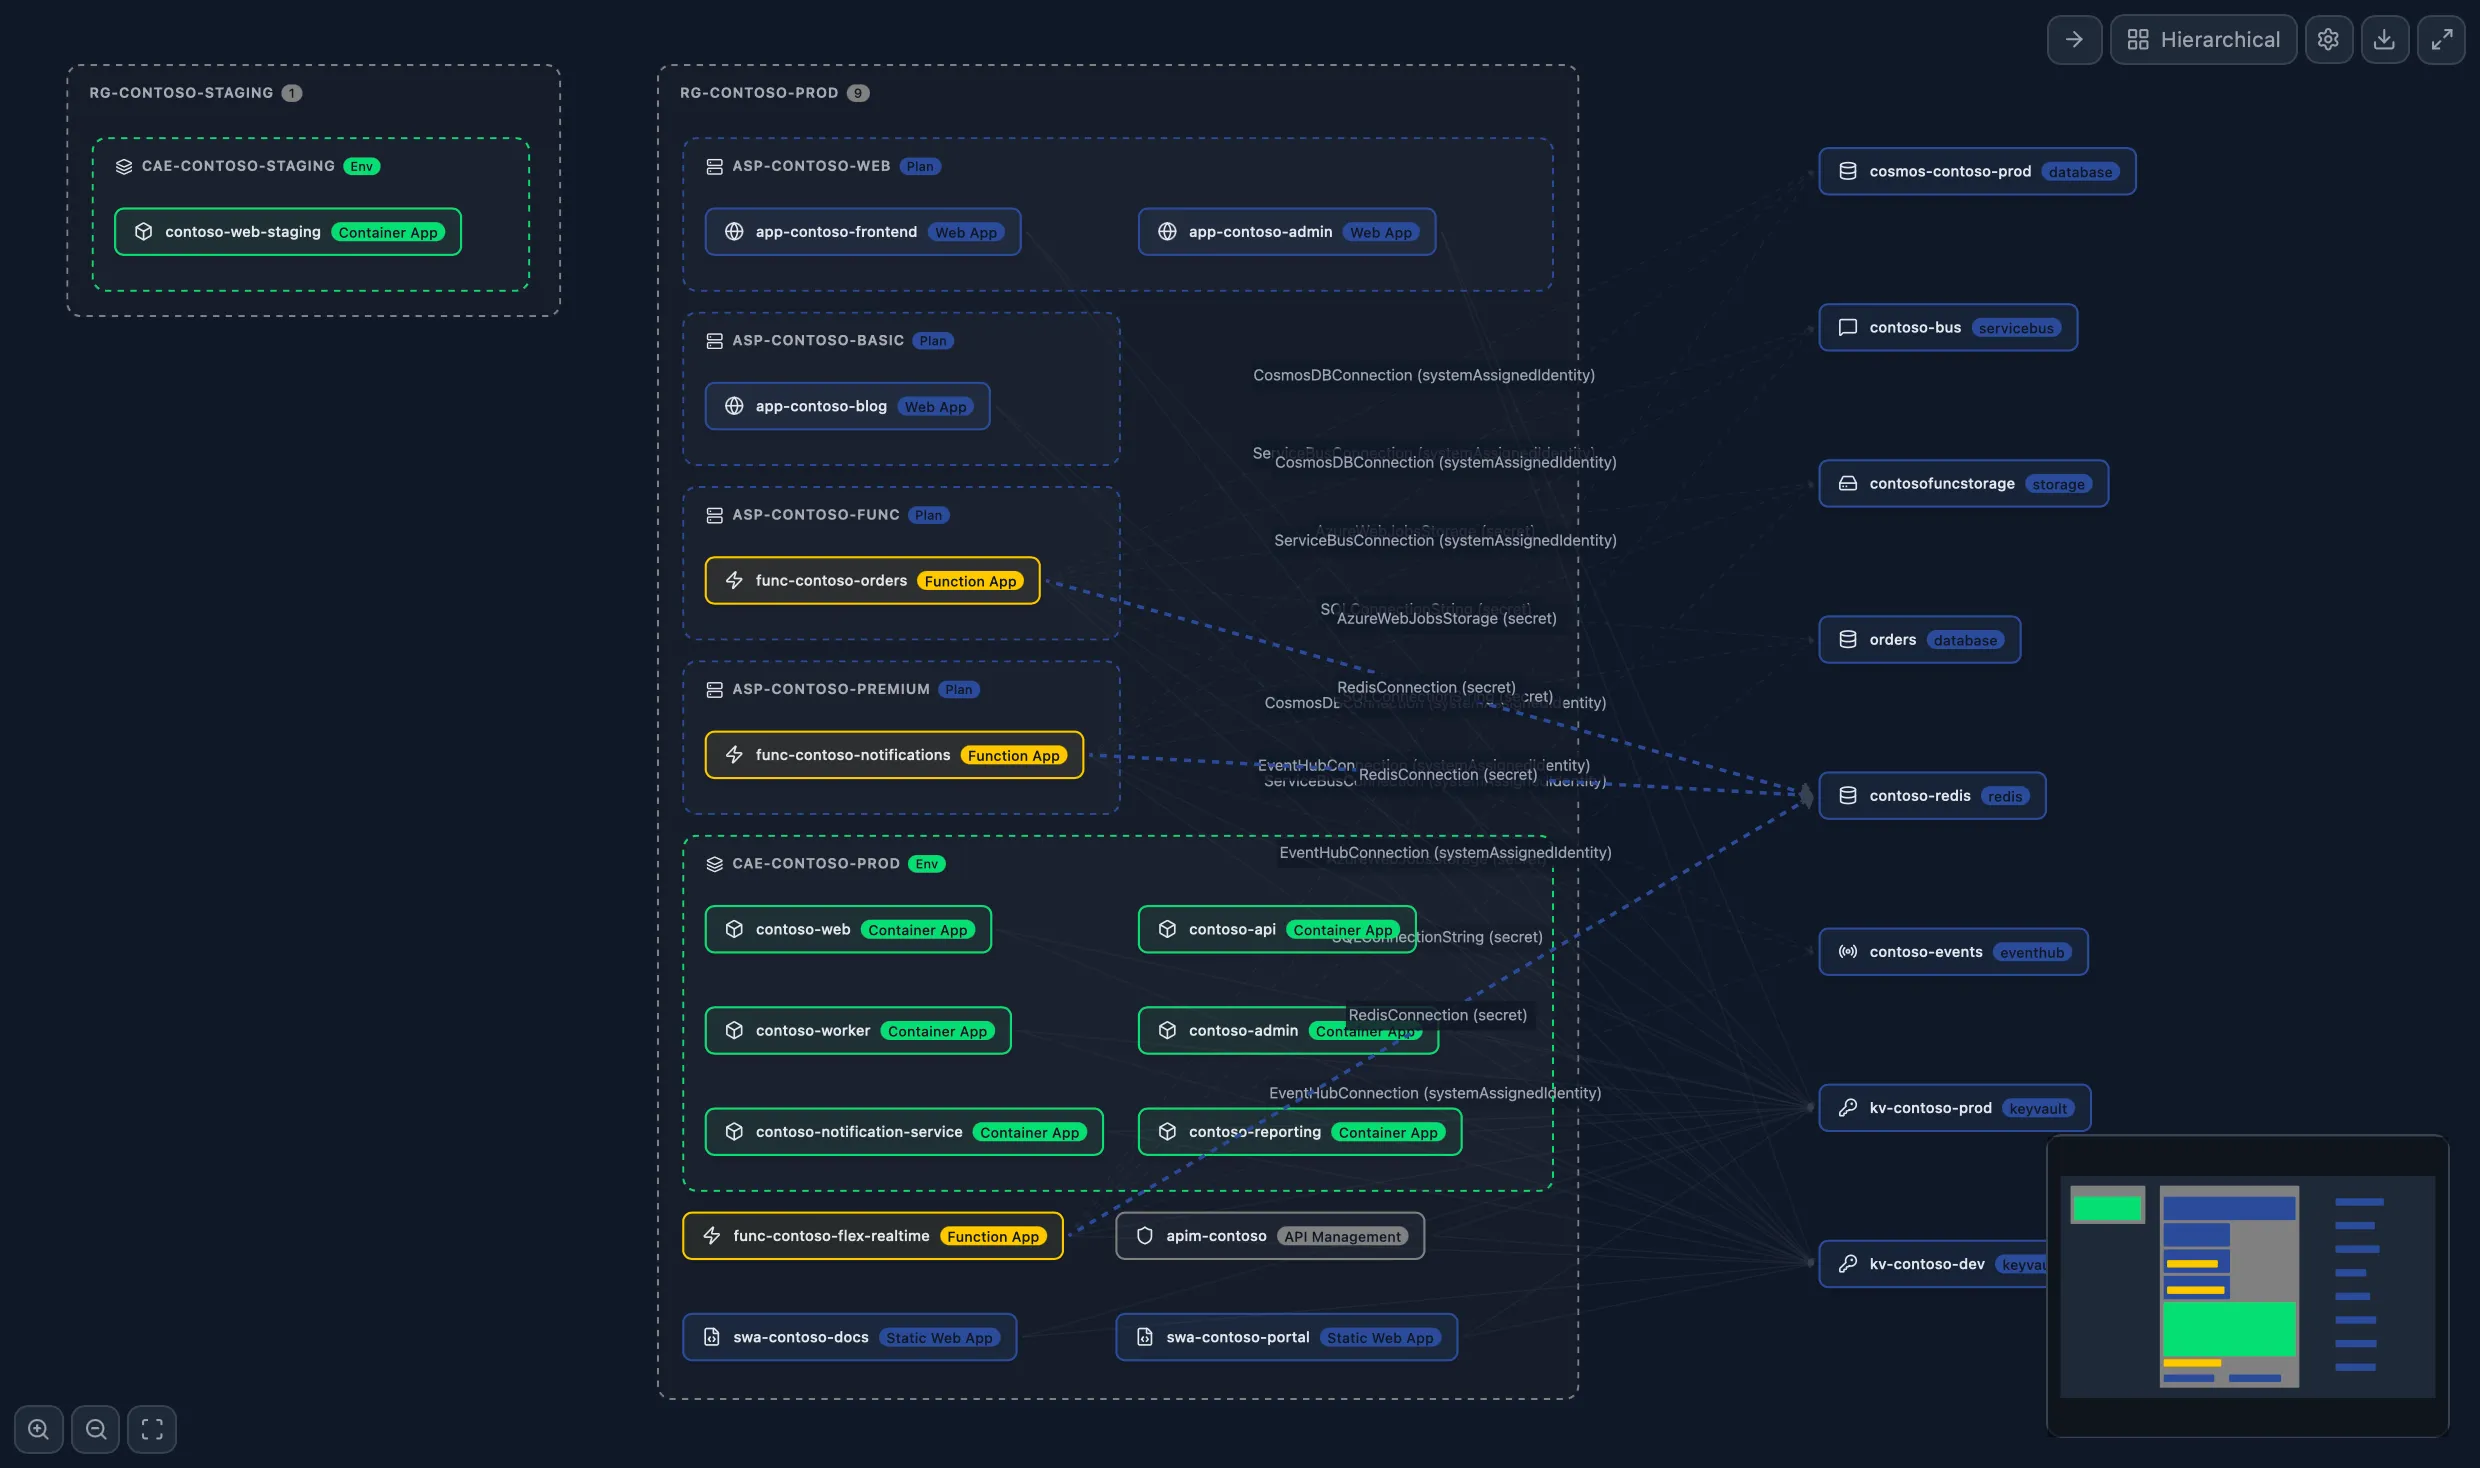
10. See the Entire Board
The Portal shows you the pieces, not the game. Your application is more than just one service. A Prizmik Suite exclusive, the Cross-Resource Dependency Map shows how all your services—Container Apps, Functions, Web Apps, and more—connect across your entire estate. It's the god-view of your architecture you've always wished you had.
Prizmik isn't about replacing the portal. It's about upgrading it. It's a professional toolkit designed to fill the gaps and give developers the speed, visibility, and control they need to do their best work.